Institutional Investing / Economics
Infographic: Strong Supply and Delta Variant Challenge Energy
To share this infographic on your website, use the embed code provided below.
Fisher Investments (FI) is an investment adviser registered with the Securities and Exchang Commission. As of July 31, 2021, FI managed $190 billion, including assets sub-managed for its wholly-owned subsidiaries. FI and its subsidiaries maintain four principal business units - Fisher Investments Institutional Group (FIIG), Fisher Investments Private Client Group (FIPCG), Fisher Investments International (PCGI), and Fisher Investments 401(k) Solutions Group (401(k) Solutions). These groups serve a global client base of diverse investors including corporations, public and multi-employer pension funds, foundations and endowments, insurance companies, healthcare organizations, governments and high-net-worth individuals. FI’s Investment Policy Committee(IPC) is responsible for investment decisions for all investment strategies.
The information in this document constitutes the general views of Fisher Investments and its subsidiaries and should not be regarded as personalized investment advice or a reflection of the performance of Fisher Investments or its clients. We provide our general comments to you based on information we believe to be reliable. There can be no assurances that we will continue to hold this view; and we may change our views at any time based on new information, analysis or reconsideration. Some of the information we have produced for you may have been obtained from a third party source that is not affiliated with Fisher Investments. Investments in securities involves the risk of loss. Past performance is no guarantee of future returns.
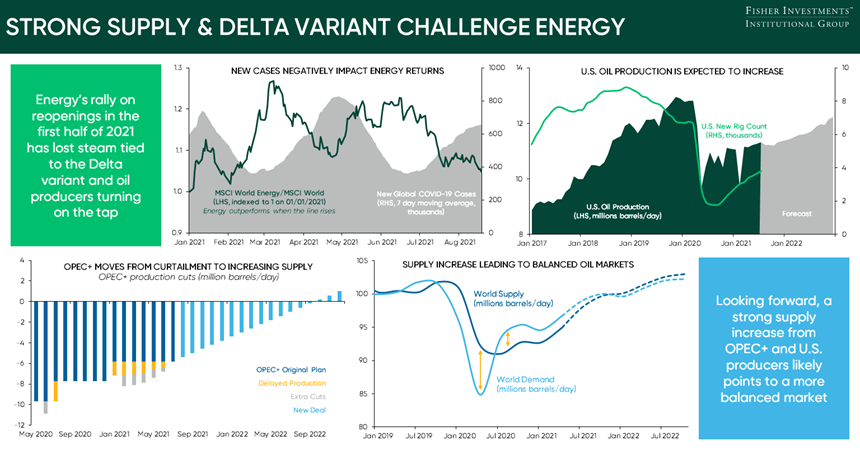
- Top Left Source: FactSet, Our World in Data. Daily returns and new COVID-19 cases, 01/01/2021 – 08/18/2021.
- Top Right Source: FactSet, Energy Information Administration Short-Term Energy Outlook August 2021, Baker Hughes. Monthly oil production and total new rigs, 01/01/2017 – 12/01/2022. Forecasts start in August 2021.
- Bottom Left Source: OPEC, production cuts relative to countries October 2018 production, May 2020 to December 2022.
- Bottom Right Source: Energy Information Administration Short-Term Energy Outlook August 2021. World production and consumption, quarterly, Q1 2019 – Q4 2022. Forecasts start in Q3 2021.
To embed this infographic on your website, copy and paste the code below:
See Our Institutional Insights
Stay on top of the latest investment trends and developments with our views and research.
Related Resources
-
Weekly Wrap-Up Fisher Investments Reviews: Last Week in Markets—October 27 - October 312025-11-03
-
Expert Commentary 3 Things You Need To Know This Week | Supreme Court & Tariffs, Jobs Data, Market Risks2025-11-03
-
Expert Commentary This Week in Review | October Recap, Central Bank Policy, Q3 GDP, Trade
 2025-10-31
 -
Market Analysis Do You Need Gold in Your Portfolio?
 2025-10-31