Personal Wealth Management / Interesting Market History
125 Years Old and Still Broken
Despite its age and status, the Dow Jones Industrial Average is a flawed index.

Editors’ Note: MarketMinder does not make individual security recommendations. The below merely represent a broader theme we wish to highlight.
Happy birthday to the Dow Jones Industrial Average (DJIA), which was born 125 years ago today. Since that first trading day, it has risen 83,737.4%, which is a very large and meaningless number—and not just because it is backward-looking.[i] Rather, because it is so poorly constructed that even with a 29-year head start on the S&P 500’s verified history, the S&P 500’s total return dwarfs it: 1,111,592.6%.[ii] Those figures are so vastly different for three simple reasons: Unlike the DJIA, the S&P 500 represents a broad swath of the US stock market, weights companies by size and includes reinvested dividends. The DJIA architects’ decision to use different methodology consigned it to a lifetime of being a broken, useless index for investors.
Now, we aren’t here to poke at Charles Dow and Edward Jones, who we reckon did the best they could when trying to create a way of measuring the overall market’s performance while having limited data and technology at their disposal. Back in the late-19th century, the non-financial segment of the US economy was mainly heavy industry and railroads, so creating two broad indexes—one for Industrials and one for Transports—more or less made sense. As did having a handful of companies in each, given the relative lack of publicly traded names. Weighting by price, not market capitalization, and excluding reinvested dividends also fit Messrs. Dow and Jones’ primary goal, which was giving people an easy way to see if the then-novel stock market was going up or down (which could then feature in The Wall Street Journal, where Dow was an editor). Share prices were visible and intuitive for the new-to-stock-investing masses to understand, so of course the creators just used an average of said prices. Using market cap instead would have required multiplication (share price times share count)—complexity!—as would factoring in dividends. Accurately gauging the overall value of Corporate America was just less important, in that situation, than tracking broad directionality.
But that was then, and we are at now, now. There are 3,463 companies in the Wilshire 5000, which includes every investible US-listed stock.[iii] That is … a lot more than 30, which is your first sign the DJIA has outlived its usefulness even as a broad indicator of what “the market” is doing. The price weighting, perhaps forgivable in 1896, is now bonkers. With a $364.51 share price as of yesterday’s close, Goldman Sachs is the second-largest DJIA component.[iv] Apple, which closed at $126.90, is in the middle of the pack. But Apple’s market capitalization, around $2.1 trillion, is about 17 times Goldman’s.[v] Which is an overall more meaningful statistic? Share price, which rests on investment bankers’ and corporate boards’ arbitrary decisions about how many shares to float? Or the overall value of a company? We think the latter, making it much more logical to weight by market cap. So whenever anyone asks us what “the market” did, we will look at the S&P 500 for the US and the MSCI World Index for global stocks. Or, if we want to get more nuanced and track US small cap, we will probably turn to the Russell 2000. Whatever your preference, all are big, broad and cap-weighted.
The DJIA is even less useful for measuring your own performance, which we have observed to be the great American investing pastime. The vast majority of investors like to track their account’s value and see how it compares to the broad market. It is a good way to hold yourself or your adviser, if you have one, accountable—and more accurate than comparing yourself to a friend, neighbor or arbitrarily chosen single stock. But the DJIA gets you nowhere in this endeavor. Your account value is not the sum of the price of every stock you own, divided by an arbitrary number. Rather, it is the sum of the value of each position you own: Stock price times number of shares, plus stock price times number of shares, lather, rinse, repeat. Your own personal market capitalization.
Then, too, a big part of stocks’ long-term returns stems from compound growth of reinvested dividends. If you invest faithfully for a few decades and plow your dividends back in, the excess compound growth they generate may also be a huge part of your returns. But the DJIA does worse than exclude this growth. When a company issues a dividend, its stock price falls by the amount of that dividend since the payment reduces the company’s value. That knocks price-weighted indexes. In other words, for the DJIA headlines commonly cite, dividends are a negative. There is a total return version of this index available, but few pay it any attention at all.
Lastly, we would be remiss if we didn’t point out that a good stock index should also be able to serve as a blueprint for portfolio construction. The DJIA doesn’t pass that test—not with just 30 companies and crazy sector weightings. If we turn the DJIA into a cap-weighted index, over half of it is Tech. The S&P 500, by contrast, is just a little more than one-fourth Tech (and the MSCI World has even less). Meanwhile, the DJIA has blind spots to Utilities and Real Estate and big underweights to most other sectors. (Exhibit 1) In our view, using the DJIA’s sector weightings as a guide for your own portfolio would probably leave you woefully undiversified.
Exhibit 1: Comparing the DJIA and S&P 500’s Sector Weightings
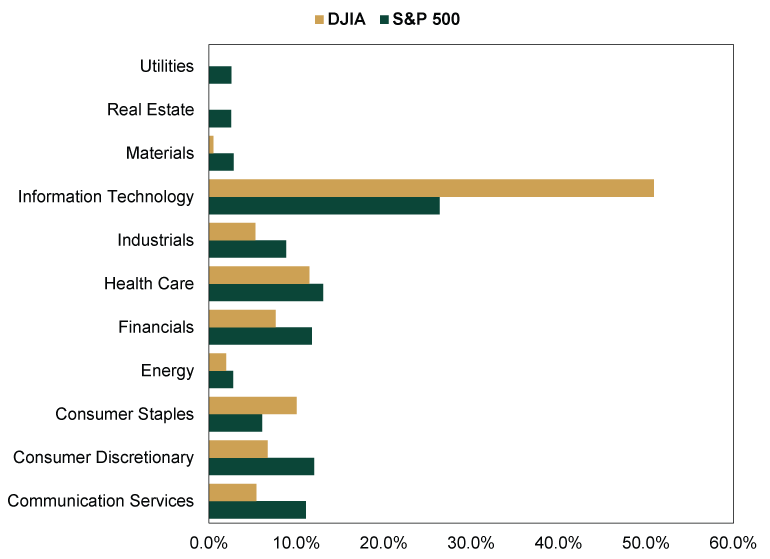
Source: FactSet, as of 5/26/2021. Based on sector weightings as of 5/25/2021.
So yes, here’s to the DJIA on its 125th birthday. Many happy returns![vi] But keep it where it belongs: on the shelf as an old relic, not a viable tool for investors today.
[i] Source: The Wall Street Journal and FactSet, as of 5/26/2021. DJIA price return, 5/26/1896 – 5/26/2021.
[ii] Source: Global Financial Data, Inc., as of 5/26/2021. S&P 500 total return, 12/31/1925 – 5/26/2021.
[iii] Source: Wilshire Associates, as of 5/26/2021. Constituent count on 12/31/2020.
[iv] Source: FactSet, as of 5/26/2021.
[v] Ibid.
[vi] Pun intended. Obviously.
If you would like to contact the editors responsible for this article, please message MarketMinder directly.
*The content contained in this article represents only the opinions and viewpoints of the Fisher Investments editorial staff.
Get a weekly roundup of our market insights
Sign up for our weekly e-mail newsletter.

You Imagine Your Future. We Help You Get There.
Are you ready to start your journey to a better financial future?

Where Might the Market Go Next?
Confidently tackle the market’s ups and downs with independent research and analysis that tells you where we think stocks are headed—and why.
Related Resources
-
Market Analysis The New Tariffs in Town Are Still Old News2026-07-24
-
Expert Commentary This Week in Review | Market Volatility, Tariffs, SpaceX
 2026-07-24
 -
Economics A Summertime Check-in on US Consumers2026-07-23
-
Expert Commentary Why Ken Fisher Is Optimistic About European Stocks
 2026-07-23


Learn More
Learn why 210,000 clients trust us to manage their money and how Fisher Investments and its affiliates may be able to help you achieve your financial goals.
As of 6/30/2026
New to Fisher? Call Us.
Contact Us Today