Personal Wealth Management / Market Analysis
A Closer Look at 2018 US Buybacks
The blowout in buybacks has many folks atwitter, but measured properly and scaled, it is hard to see why.

US stock buybacks are a hot topic this year, with the media working itself into a tizzy on stories running the gamut from whether buybacks deepen inequality[i] to whether they are the one thing keeping stocks afloat.[ii] At its root, the debate hinges on a widely held belief companies are binging on their own stock. It is pretty unsurprising, then, that when a report[iii] estimated Q2 buybacks doubled records—clocking in at nearly $440 billion—sensationalist headlines surged, too.[iv] There are multiple problems with these theories, but here is a primary one: The numbers overstate reality, giving the impression increased buybacks are a bigger deal than they really are. Taking the time to properly measure and scale buybacks adds needed perspective to the issue.
Measuring Buybacks
Big, eye-catching numbers are the stuff great headlines are made of, but very often, the details prove them overstated. Consider that ~$440 billion Q2 number: It is based on announced buybacks in Q2, not executed buybacks. That may seem semantic, but it isn’t. Companies often announce plans they later cancel—without notice. Further, planned buybacks carry neither an expiration date nor a minimum repurchase amount. So even buybacks firms announce in Q2 aren’t certain to happen in Q2, 2018—or ever.
We often remind investors considering political chatter, central bankspeak and more that talk is cheap. The same goes here. Watch what companies do, not what they say. When it comes to gauging stock buybacks, this means focusing on actually completed buyback activity. Our own research shows executed buybacks were closer to $213 billion in Q2, not $440 billion. That is still a new high-water mark in absolute dollar terms, but not by very much—and certainly not doubling prior high-water marks.
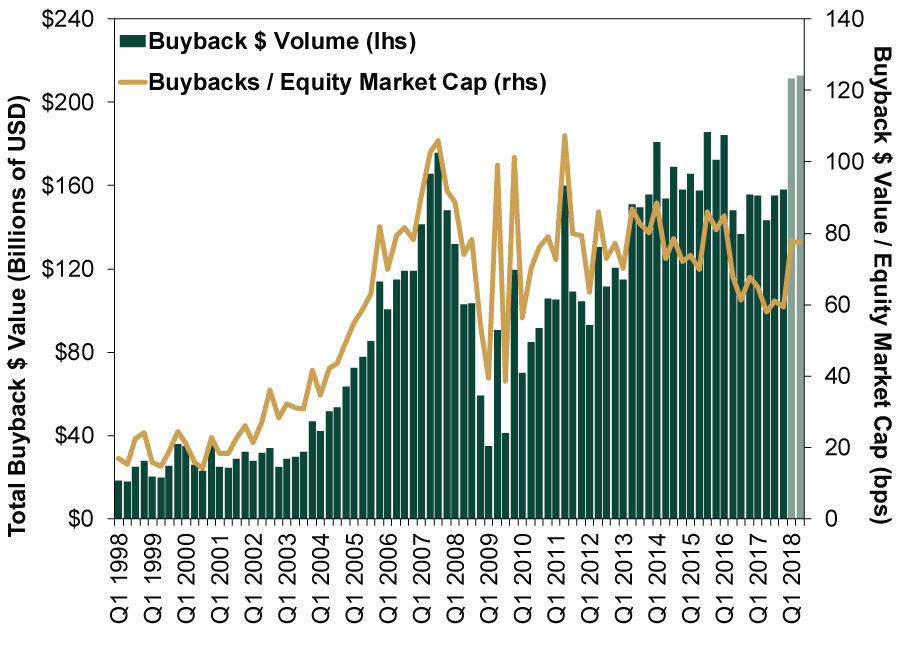
Exhibit 1: Quarterly Executed US Buyback Volume
Source: Factset, as of 9/7/2018. Total quarterly share buyback volume for all US publicly traded companies, Q1 1998 – Q2 2018.
Scaling Buybacks
In our view, buybacks are bullish, shrinking equity supply and increasing shareholders’ stake in corporate earnings. Yet skeptics eagerly point to those lofty Q2 estimates as evidence companies repurchasing their stock are singlehandedly driving stocks up (or, at least, preventing a drop). To this, we say: Yes, executed buybacks have been high (again, not a bad thing!), but scale matters. Here is something we haven’t seen anyone else point out: 2018 buyback volume relative to total US stock market capitalization hasn’t been unusual. As Exhibit 1 shows, Q1 and Q2 2018 buybacks weighed in a hair under 0.8% of total market cap, almost matching the current market cycle average of 0.77%. In other words, while buybacks are a positive, they aren’t the only reason stocks are rising. They are simply a small part of a broadly bullish backdrop.
Investors panic when buyback volume drops,[v] yet they eye it with alarming suspicion when activity ramps up. Politicians preen about curtailing surging buybacks, blaming them of robbing workers of pay increases. But measured and scaled properly, we see little reason to believe buybacks’ rise this year merits all the attention.
[i] “Are Stock Buybacks Deepening America’s Inequality?” Matt Egan, CNN Money, 3/5/2018
[ii] “Dearth of Equity Keeps Stock Market Bull Alive,” Sujata Rao, Helen Reid, and Chuck Mikolajczak, Reuters, 9/26/2018
[iii] Source: TrimTabs Investment Research and GaveKal Research using TrimTabs data.
[iv] “Tax Cut Triggers $437 Billion Explosion of Stock Buybacks,” Matt Egan, CNN Money, 7/10/2018
[v] “Bull Market Losing Big Ally as Buybacks Fall Most Since 2009,” Lu Wang, Bloomberg, 5/15/2016
If you would like to contact the editors responsible for this article, please message MarketMinder directly.
*The content contained in this article represents only the opinions and viewpoints of the Fisher Investments editorial staff.
Get a weekly roundup of our market insights
Sign up for our weekly e-mail newsletter.

You Imagine Your Future. We Help You Get There.
Are you ready to start your journey to a better financial future?

Where Might the Market Go Next?
Confidently tackle the market’s ups and downs with independent research and analysis that tells you where we think stocks are headed—and why.
Related Resources
-
Expert Commentary This Week in Review | Global PMIs, SpaceX, RMD Planning
 2026-07-10
 -
Market Analysis Trim Your Angst on Economic Measurement Tweaks2026-07-09
-
Politics Long-Term Forecasts and Court Verdicts: The Latest in British and French Politics2026-07-09
-
Corporate Information How You Benefit from Fisher Investments' Transparent Fee Structure
 2026-07-08


Learn More
Learn why 210,000 clients trust us to manage their money and how Fisher Investments and its affiliates may be able to help you achieve your financial goals.
As of 6/30/2026
New to Fisher? Call Us.
Contact Us Today