Personal Wealth Management / Economics
A Look at GDP’s First-Half Dip—and Beyond
Stocks are the best leading indicator, and what matters to them is ahead—not behind.

Editors’ note: The definition of a recession has become a partisan topic of late, but as political bias can lead to investing mistakes, please keep in mind MarketMinder’s GDP discussion focuses only on its potential market impact, if any.
Q2 US GDP fell -0.9% annualized, its second quarterly decline after Q1’s -1.6% dip.[i] Headlines feverishly debate whether this spells recession, with mostly partisan political implications that we won’t delve into—for investors, that debate is largely backward-looking. Months-old economic activity has little relevance for stocks, which we think have already dealt with the mild economic contraction and are looking ahead to what the next 3 to 30 months have in store relative to expectations.
Stocks move ahead of economic activity, and bear markets often precede recessions as stocks discount the likely decline in investment and corporate earnings. This year’s shallow (to date) bear market would be pretty consistent with a shallow recession. But whether or not one is underway is questionable. The National Bureau of Economic Research (NBER), which is the official arbiter, doesn’t define a recession as two sequential GDP contractions. Rather, it defines it as a “significant decline in economic activity that is spread across the economy and lasts more than a few months.” Diving under the hood of Q2’s GDP report, there are reasons to question whether the US economy meets that threshold.
Exhibit 1 breaks out net exports (red columns) and inventories (yellow) by their contribution to headline growth (dark blue line). It also shows government’s contribution (light blue) and three major GDP components: consumer spending (71% of GDP), business investment (15%) and residential investment (3%) in shades of green, representing pure private sector domestic demand.
Exhibit 1: GDP Breakdown
Source: FactSet, as of 7/28/2022. GDP and components, Q3 2021 – Q2 2022.
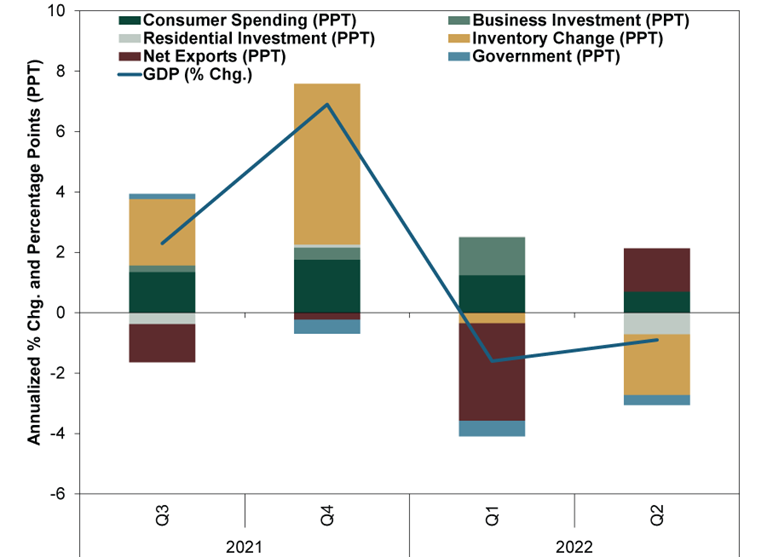
In Q1, while trade subtracted heavily as imports (which reflect domestic demand) jumped, consumer spending and business investment were fine. In Q2, trade added to GDP—exports rose more than imports—but inventories’ big subtraction more than offset it. This could be a delayed giveback from Q4’s huge inventory surge, presuming it stays in the data. In Q1, the BEA initially reported inventories subtracted -0.84 percentage point (ppt) from headline growth. But the BEA substantially reduced that in later revisions to the tiny detraction shown in Exhibit 1. Q2’s report similarly faces several rounds of revision from here.
Regardless, inventories are always open to interpretation. A reduction could mean demand outstripped supply, or it could mean businesses had to clear a supply glut. The latter seems more likely. All last quarter, major retailers reported heavy discounting to clear inventory overhangs. It is possible Q4’s huge holiday stocking met with ongoing supply chain uncertainty in Q1 to keep reductions at bay, but as bottlenecks started to ease in Q2, managers felt more comfortable letting inventories run off.
Elsewhere, consumer spending rose 1.0% annualized, a slowdown, while fixed investment fell -3.9%, shaving -0.72 ppt off headline growth. This has many worrying the downturn is more than just temporary supply-chain-related hiccups. The investment drop, however, was almost entirely residential real estate. While it took a chunk out of GDP last quarter as new home sales stalled, residential real estate is a sliver of the total US economy. No surprise many got cold feet from rising mortgage rates, which could persist near term. But with new homes under construction hitting record levels, affordability could improve in time.
Meanwhile, business investment, usually recession’s swing factor, declined -0.1% annualized, subtracting a miniscule -0.01 ppt from headline growth. Now, flattish capital expenditures aren’t exactly a resounding economic confidence booster. Coupled with the inventory decline, it could signal businesses are getting lean and presage investment decreasing further. But we hesitate to draw that huge of a conclusion from a single-quarter’s minute dip.
So although Q2 was mixed, does it constitute a recession? NBER’s eight-member business cycle dating committee will officially decide, but it will only be in hindsight—and likely far into the rear view by the time it does. In the meantime, others are free to choose their narratives.
For forward-looking markets, though, recession calls are of little relevance. We don’t think it is very helpful to get caught up in after-the-fact refereeing when stocks have long since moved on. GDP reports are a backward look at what markets have already anticipated. Declaring a recession based on them—or any other measure—is even more backward looking.
Whatever you want to dub it, a greater than -20% decline from January’s highs through mid-June suggests a substantial amount of economic weakness is reflected in stocks already. What matters from here is how things go relative to expectations. A deep, lasting recession could mean stocks have more negativity ahead. But, while possible, it isn’t necessarily probable. The 10-year to 3-month Treasury yield curve—a key leading economic indicator—remains positively sloped, and even if the Fed continues hiking and it inverts, that isn’t necessarily a trigger or harbinger. This is because banks’ deposit rates—their funding costs for new loans—remain close to zero, keeping new lending profitable with long-term rates higher than 10-year Treasury yields. Moreover, while it is backward-looking relative to the yield curve, through mid-July, loan growth has accelerated to 10.5% y/y, its highest rate in over a decade (excluding pandemic lockdown emergency lending), which isn’t what you typically see in or entering recession.[ii]
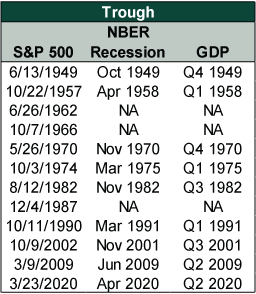
In any event, remember stocks are a leading economic indicator, too. They can be volatile—as the economist Paul Samuelson once observed, “the stock market has predicted nine out of the last five recessions.” But more often than not, as Exhibit 2 illustrates, the market will turn higher well before GDP does. (Note the exception in 2002: Stocks’ ultimate low came long after the recession ended as heavy-handed Sarbanes-Oxley financial regulations slammed them anew.) So nothing in stocks’ upturn since June 16 is inconsistent with the US enduring a shallow recession. It may be, though we can’t know for sure, that stocks are moving on to pricing in an economic recovery ahead.
Exhibit 2: Stocks Usually Trough Before GDP
Source: FactSet and NBER, as of 7/28/2022. S&P 500 price index, 1/1/1947 – 7/28/2022, NBER business cycle trough dates and GDP, Q1 1947 – Q2 2022.
If you would like to contact the editors responsible for this article, please message MarketMinder directly.
*The content contained in this article represents only the opinions and viewpoints of the Fisher Investments editorial staff.
Get a weekly roundup of our market insights
Sign up for our weekly e-mail newsletter.

You Imagine Your Future. We Help You Get There.
Are you ready to start your journey to a better financial future?

Where Might the Market Go Next?
Confidently tackle the market’s ups and downs with independent research and analysis that tells you where we think stocks are headed—and why.
Related Resources
-
Market Analysis On the June Inflation Cooldown2026-07-14
-
Expert Commentary 3 Things You Need to Know This Week | US Inflation, China GDP, US Retail Sales
 2026-07-13
 -
Weekly Wrap-Up Fisher Investments Reviews: Last Week in Markets—July 6 - July 102026-07-13
-
Expert Commentary This Week in Review | Global PMIs, SpaceX, RMD Planning
 2026-07-10


Learn More
Learn why 210,000 clients trust us to manage their money and how Fisher Investments and its affiliates may be able to help you achieve your financial goals.
As of 6/30/2026
New to Fisher? Call Us.
Contact Us Today