Personal Wealth Management / Economics
A Solid Earnings Season
Is Q4 2013’s better-than-expected corporate earnings growth sustainable enough for the bull to carry on?

Big company X beats! Tech firm Y disappoints. Health Care firm Z surges past expectations. Biotech leader XY misses badly. Earnings season. That time of year when many investors fixate on individual firms’ earnings—shiny objects. But relatively few take time to look at the broader backdrop. Here it is: With the bulk of Q4 2013 corporate earnings released, results remain strong and continue exceeding expectations. And this isn’t just hollow, cost-cutting profits—sales are growing nicely, too. America’s private sector continues to be stronger than most appreciate, buoyed by growing demand and giving this bull market plenty of fundamental support.
So far 442 companies in the S&P 500 have reported earnings for Q4 2013 with aggregate S&P 500 Q4 earnings per share growing +8.5% y/y. Of those reporting thus far, 72% beat expectations—largely in line with recent averages. As usual, growth varied by sector. Financials led the pack with an eye-popping +25.2% y/y, rebounding from Q3’s drop. Materials followed at +24.7% y/y, thanks to an easy year-over-year benchmark. The only drops came in Utilities at -2.8% y/y and Energy at -9.7% y/y.1
Ordinarily, strong earnings growth would be something to cheer—and in our view, it is. Growing profits at publicly traded companies are a strong foundation for this bull market. Yet a common objection has developed among investors in recent months: Many assume earnings growth is solely a function of cost-cutting, not revenue growth, and without stronger sales, profits won’t be sustainable—nor will this bull market.
On the surface, it’s easy to see why folks might believe this. Index-level earnings and revenue growth is typically reported as a percentage rate—and revenue’s growth rate is often lower than earnings’ growth rate. That was certainly true in Q4, with S&P 500 companies reporting aggregate revenue-per-share growth of +0.8% y/y.2 But this doesn’t mean revenues were materially weaker than earnings! It just means revenue growth is calculated off a much bigger base than earnings—total S&P 500 net revenue in Q4 2012 was about $2.67 trillion, while total net income (earnings) was about $244 billion.3 Revenues might have grown at one-tenth the speed as earnings, but total revenues were also over 10 times as big.
To see how earnings and revenues really compare, look at the actual dollar increases. Q4 2013 earnings, thus far, are up $20.6 billion from Q4 2012. Revenues are up only a hair less, $19.4 billion. Revenues drove nearly all earnings growth. This effect is magnified if you look at the sector breakdown. (Exhibit 1)
Exhibit 1: Q4 2013 Breakdown of Earnings and Revenue Growth
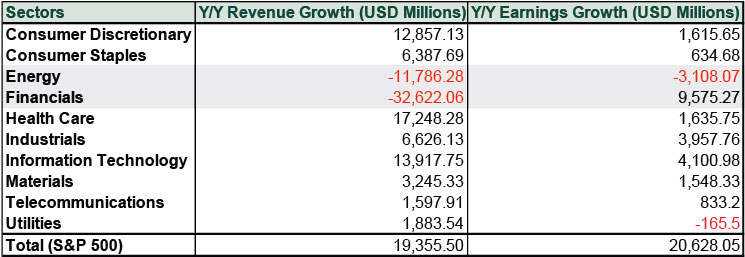
Source: FactSet, as of 2/21/2014.
Only in two sectors did revenues lag earnings—everywhere else, revenues grew more. The sectors where revenues lagged are hardly bellwethers for broader weakness. One was Financials, where the $9.6 billion rise in earnings paired with a $32.6 billion drop in revenues. Now, it might not sound great that the sector with the highest earnings growth rate got there solely by cutting costs. But in this case, it’s mostly due to one-off legal and regulatory costs some firms incurred in 2012. Those largely weren’t in the mix in Q4 2013, giving firms an easy boost in the cost department. As for revenues, Financials’ revenues have been variable throughout this bull market—nothing about this signals an inflection point. Energy, too, benefited from cost cutting, which helped offset some of the impact of pressured natural gas and oil prices—a long-running issue for this sector, thanks to the shale boom.
Everywhere else, however, revenues led the charge. In Consumer stocks, Health Care and Tech, modest earnings increases obscured just how strong revenues were! This is rather in line with how earnings and revenues typically look in a maturing bull market. Early in an expansion, small revenue growth provides a big earnings boost thanks to heavy cost-cutting during the recession. As the expansion progresses, however, firms have to raise costs to keep up with demand. Then, revenue growth becomes a bigger driver—firms that can grow revenues faster than costs rise take the catbird seat. In our view, that’s where Consumer Discretionary, Technology and Health Care are today—ditto for most of the big, diverse, high-quality companies in the world. Companies with flexible cost structures and exposure to areas where demand growth is strongest are well-positioned for revenue-driven earnings growth in a maturing bull.
Few see it this way, but in our view, that’s bullish. False fears and backward views lower expectations, creating more room for reality to surprise, and that surprise pushes stocks higher. Looking ahead, there appears plenty of room for earnings and revenues to continue surprising investors, fueling this bull market.
1 FactSet Earnings Insight, as of 2/21/2014.
2 FactSet Earnings Insight, as of 2/21/2014.
3 FactSet, as of 2/21/2014.
If you would like to contact the editors responsible for this article, please message MarketMinder directly.
*The content contained in this article represents only the opinions and viewpoints of the Fisher Investments editorial staff.
Get a weekly roundup of our market insights
Sign up for our weekly e-mail newsletter.

You Imagine Your Future. We Help You Get There.
Are you ready to start your journey to a better financial future?

Where Might the Market Go Next?
Confidently tackle the market’s ups and downs with independent research and analysis that tells you where we think stocks are headed—and why.
Related Resources
-
Market Analysis Excess Fear Over ‘Excess’ Profits2026-06-25
-
Market Analysis Today in Brexit, Day 3,652: Brexit Turns 102026-06-23
-
In The News What ‘IPO’ really stands for — and whether you should be buying SpaceX and the AI giants2026-06-23
-
In The News Expert says investors are ignoring a massive global rally2026-06-22


Learn More
Learn why 200,000 clients trust us to manage their money and how Fisher Investments and its affiliates may be able to help you achieve your financial goals.
As of 3/31/2026
New to Fisher? Call Us.
Contact Us Today