Personal Wealth Management / Market Analysis
Bad Breadth Doesn’t Stop Bull Markets
If anything, fears about market breadth help extend stocks’ gains.

Across the financial press, a common theme has begun emerging: Fewer and fewer stocks are performing well—so-called narrowing market breadth—which, to proponents, means this bull market is fragile. Don’t buy it—in our view, this is faulty logic. Narrowing breadth is normal as bull markets mature, and there is no preset level indicating the bull market’s end is near. To us, it is just another sign this less-than-two-year-old bull market is acting late stage. However, we think widespread fear of typical bull market behavior is yet another indication stocks have more room to run.
There are several different ways to measure market breadth. Some look at the number of stocks hitting new 52-week lows, which are currently far outpacing new highs. Others track the “advance-decline line”—the ratio of advancing stocks to declining ones. Early this week, some touted the fact daily NYSE and Nasdaq decliners outnumbered advancers by about four to one.[i] Our preferred measure is the percentage of stocks outperforming the index average. For the S&P 500, this jumped to 61% during value’s early 2021 countertrend rally amid optimism over mass vaccine rollouts and global economic reopening. But it has steadily declined since last May, with only 44% now beating the index on a rolling 12-month basis. (Exhibit 1)
Exhibit 1: Narrowing Market Breadth Doesn’t Always Spell Doom
Source: Clarifi, as of 1/13/2022. Percent of S&P 500 stocks beating the trailing 12-month S&P 500 total return, 12/31/1975 – 1/12/2022.
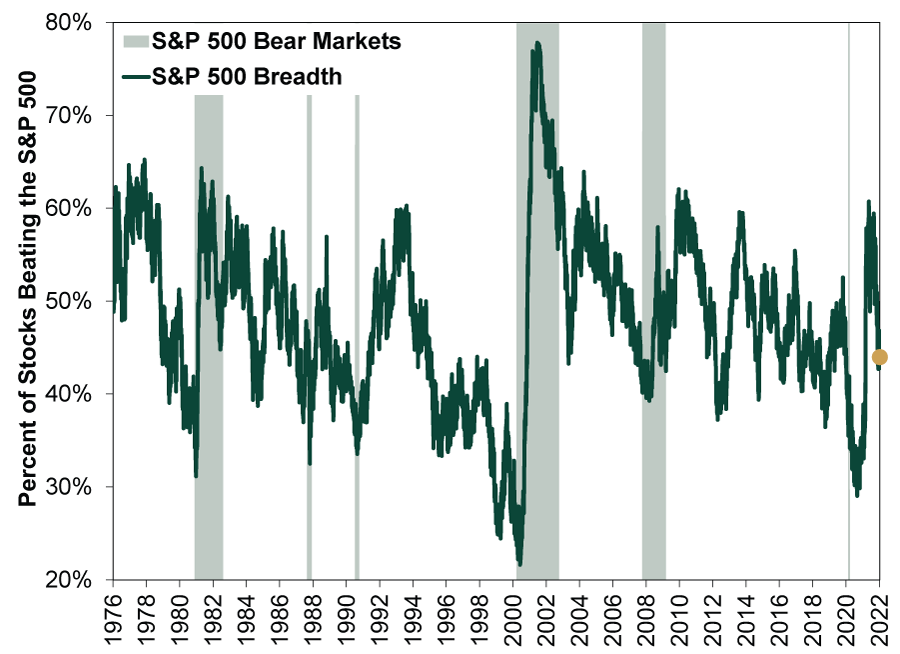
When the current S&P 500 bull market began in March 2020, its breadth (as we define it) was below 40%. It stayed low through the rest of the year. Spring 2021’s subsequent broad-based gains weren’t unwelcome, but the narrowing breadth that followed in 2021’s second half didn’t stop the bull market, either.
Narrow breadth at the market cycle’s start is atypical. Ordinarily, during a bear market’s depths, depressed sentiment overshoots reality by miles. Many small-cap and economically sensitive value stocks—the majority of the market in numbers—crater the most. The ones surviving, though, are mostly running lean and mean, after frozen credit markets and sagging sales forced them to slash costs. This means that, as the economy revives, their earnings growth can soar off low bases. Markets, anticipating earnings’ upswing, often launch these stocks upward well before recessions officially end. This is why in standard market and business cycles, small-cap and value stocks generally lead off a bear market low—and why breadth is usually high early in a bull market. For example, coming out of 2007 – 2009’s bear market, the S&P 500’s breadth hit over 55% routinely through 2011.[ii]
Later in the cycle, after the initial upsurge, stocks settle down; the market’s winnowing process gets tougher—there are fewer winners. As the bull market matures, earnings growth tends to slow significantly. Year-over-year benchmarks become tougher to beat. Many companies reach the end of what they can squeeze out by cutting costs (largely under their control) and must rely increasingly on revenue growth (less controllable) to drive earnings. Then too, GDP growth usually slows to a more pedestrian pace after the recovery phase out of recession—as economic activity hits its prior peak and begins a new expansion phase.
At this point, it can get harder for companies to outperform. This is when large-cap and growth stocks tend to take the leadership reins, as their higher-quality characteristics shine. Because they feature strong balance sheets, high margins and growth prospects independent from the broader economy’s, they stand out from the crowd—able to generate earnings on their own accord when most others may begin to flounder. There just aren’t as many stocks with high-quality, growth traits. So breadth narrows.
That is what normally happens. But as we noted, this cycle’s breadth looks very different—narrow out of the gate with a brief bump early last year that subsided fast. In our view, this is due to the lockdown bear market’s very unusual cause—and duration. We think it was too short to reset the cycle. Ditto for the fleeting downturn’s effect on the broad economy. Contraction from lockdowns was short and sharp. It came when businesses hadn’t built up a lot of excess and inefficiency. Lockdowns—and associated government support—suspended economic activity. As those ended, the economy overall picked up where it left off. We think this is why large-cap growth stocks have led throughout—a fact supercharged early by big growth firms’ business models being very aligned with a locked-down world.
Looking back on the whole, what that leaves is a young bull market with an old soul. If you treat 2020’s lockdown-driven bear market as a hugely oversized correction, stocks are behaving as if this new bull market is a continuation of 2009 – 2020’s. Narrow breadth and growth leadership characterized the previous one as it ended. Those features reasserted themselves immediately in this one. The new bull market just resumed the same late-cycle behavior as before global lockdowns temporarily interrupted.
This time around, many fret narrow breadth makes the bull market fragile. If the few stocks leading falter, they posit, the market will plummet. But as history shows, while market breadth does narrow as bull markets age, there is no magic level indicating a problem. Look back to Exhibit 1. The S&P 500’s breadth was under 40% in 2012, 2014 and 2018. None signaled an imminent end to the bull market. In the 1990s’ bull market, breadth was below 40% through most of its latter half, hitting 24% at the market’s March 2000 peak.
In our view, fears over narrow market breadth show sentiment is far from the euphoria that typifies market tops. That euphoria pushes expectations to levels reality can’t possibly attain—and leads investors to dismiss risks. It is that feature which usually makes bull markets fragile—not narrow breadth.
If you would like to contact the editors responsible for this article, please message MarketMinder directly.
*The content contained in this article represents only the opinions and viewpoints of the Fisher Investments editorial staff.
Get a weekly roundup of our market insights
Sign up for our weekly e-mail newsletter.

You Imagine Your Future. We Help You Get There.
Are you ready to start your journey to a better financial future?

Where Might the Market Go Next?
Confidently tackle the market’s ups and downs with independent research and analysis that tells you where we think stocks are headed—and why.
Related Resources
-
Market Analysis The New Tariffs in Town Are Still Old News2026-07-24
-
Expert Commentary This Week in Review | Market Volatility, Tariffs, SpaceX
 2026-07-24
 -
Expert Commentary Why Ken Fisher Is Optimistic About European Stocks
 2026-07-23
 -
Economics A Summertime Check-in on US Consumers2026-07-23


Learn More
Learn why 210,000 clients trust us to manage their money and how Fisher Investments and its affiliates may be able to help you achieve your financial goals.
As of 6/30/2026
New to Fisher? Call Us.
Contact Us Today