Personal Wealth Management / Interesting Market History
Fact Check: Was 2013’s ‘Taper Tantrum’ Actually So Tumultuous?
Spoiler alert: No.

Every now and then, pundits repeat an offhand, unsourced remark so often that it becomes accepted as fact. Then it takes on a life of its own, becoming the generally accepted version of events. Everyone echoes it, no one checks it and, in some circumstances, it can actually affect people’s actions and expectations in the here and now. This happens a lot with general statements about market data, and we have seen a big one lately: the widespread perception that the market volatility surrounding the Fed’s chatter about “tapering” quantitative easing (QE) bond purchases in 2013 was huge, and policymakers must avoid a repeat at all costs. But actually, reality was benign, as we will show, another reason a taper isn’t worth fearing today.
We aren’t calling anyone malicious here. Rather, we think it illustrates the problems with using figurative language to describe market volatility. We enjoy calling a big drop a “plunge” and a big rise a “jump” as much as anyone—colorful synonyms punch up writing and can make the dry topic of market movement easier to read. But in 2013, when markets got a bit rocky after then-Fed head Ben Bernanke first alluded to tapering in May, some clever wordsmith with a fondness for alliteration coined a new term: taper tantrum. It was snappy. It spread globally. We used it a few times, mostly with scare quotes and always with numbers putting it in perspective. But many pundits disregarded the context, didn’t reference actual return figures, and just used “taper tantrum” as if the entire nuanced meaning were self-evident. It has since taken on a life of its own, fueling the belief that “tantrum” must mean some catastrophic drop in stock and bond prices. Anyone who has ever been around a toddler knows a tantrum is a lot worse than a short cranky outburst—basically one notch short of meltdown. So that logic, applicable in human behavior, influences assumptions about how much the market dropped. Hence, the metaphor morphs to generally accepted “fact” in public consciousness.
So let us drop the flowery prose and look at the cold hard facts, starting with stock returns. Exhibit 1 shows the S&P 500 in 2013. Bernanke alluded to tapering during Congressional testimony on May 22, during market hours. That day is when the volatility began. As you will see, it wasn’t huge. It was a -5.6% pullback over just a bit longer than a month.[i] It wasn’t even big enough to qualify as a correction, which is a sentiment-driven drop of about -10% to -20%. It certainly wasn’t a bear market, which is a deep, typically lasting, fundamentally driven decline of -20% or worse. It was just standard short-term volatility. Moreover, stocks rebounded quickly, hitting new highs by mid-July. The year as a whole was one of the S&P 500’s best on record, a 32.4% rise.[ii] Who wouldn’t want a repeat?
Exhibit 1: Wait, What Tantrum?
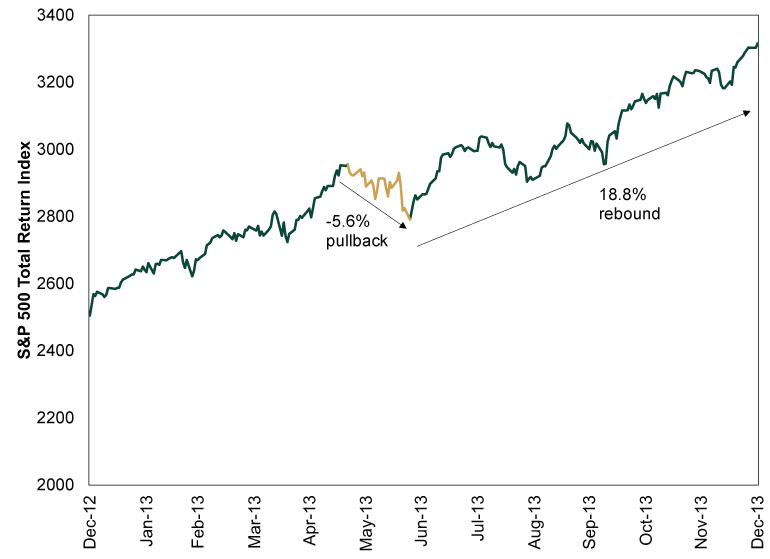
Source: FactSet, as of 7/28/2021. S&P 500 Total Return Index, 12/31/2012 – 12/31/2013.
To be fair, bond market volatility was a bit more material and longer-lasting. But it, too, wasn’t as bad as most coverage implies. Exhibit 2 shows the 10-year Treasury yield in 2013, 2014 and 2015. While 2013 was the year of Taper Talk, 2014 was the year tapering actually happened, and 2015 was the great taper aftermath. In 2013, the 10-year yield’s low was 1.66% on May 2. On May 22, Taper Talk Day, it jumped from 1.94% to 2.03%. It kept rising, in fits and starts, through the rest of the year.
But December 31, 2013 was the 10-year yield’s peak. Its closing level that day, 3.04%, is low by any reasonable historical standard. A rise of about one percentage point from generational lows to a still very low rate is not huge in the grand scheme of things. Nor was it catastrophic for diversified long-term bond portfolios: In 2013, ICE BofA’s 7-10 Year US Government & Corporate Bond Index did decline on a total return basis, but only -4.4%.[iii]
What happened the following year is even more interesting, in our view. As Exhibit 2 shows, the Fed announced the beginning of tapering on December 18, 2013. It then steadily reduced monthly bond purchases throughout 2014, winding them down entirely in late October. Yet 10-year yields fell during this span—and kept falling after QE was finished. By February 2015, they were back at pre-taper talk levels. They inched up a bit over the rest of the year but never topped 2.5%. Accordingly, the ICE BofA’s 7-10 Year US Government & Corporate Bond Index delivered an 8.7% total return in 2014, more than erasing 2013’s setback.[iv] The total return for the full two-year stretch was 3.9%.[v] 2015 added another 1.0%, bringing cumulative returns over those three years to 4.9%.[vi] Here, too, we have a hard time seeing what today’s fuss is about.
Exhibit 2: More Mild Fussiness Than Tantrum
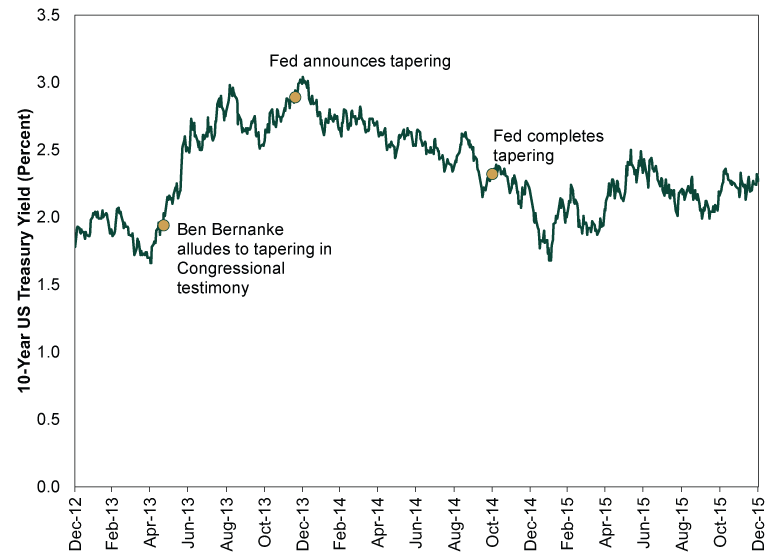
Source: FactSet, as of 7/28/2021. 10-Year US Treasury Yield (Constant Maturity), 12/31/2012 – 12/31/2015.
In our view, the lessons for today’s investors are twofold. One, turn your most critical gaze to articles arguing tapering is bad for markets and use 2013’s volatility as their primary evidence—and don’t let them goad you into making knee-jerk portfolio moves to avoid potential volatility. Two, beware humans’ innate tendency to magnify negative volatility and downplay the positive. This phenomenon, known as myopic loss aversion, is likely what enabled the “taper tantrum” metaphor to gain such stature. On a more personal level, it often inspires investors to seek to avoid short-term setbacks—usually at the expense of longer-term gains. Reality is frequently much milder than headlines—and mental errors—trick people into believing it is. So always, always, always fact-check general claims about volatility—including your own memory and fears.
[i] Source: FactSet, as of 7/28/2021. S&P 500 total return, 5/21/2013 – 6/24/2013.
[ii] Source: FactSet, as of 7/28/2021. S&P 500 total return, 12/31/2012 – 12/31/2013.
[iii] Source: Ibid. ICE BofA US Corporate & Government Index (7 – 10Y) total return, 12/31/2012 – 12/31/2013.
[iv] Ibid. ICE BofA US Corporate & Government Index (7 – 10Y) total return, 12/31/2013 – 12/31/2014.
[v] Ibid. ICE BofA US Corporate & Government Index (7 – 10Y) total return, 12/31/2012 – 12/31/2014.
[vi] Ibid. ICE BofA US Corporate & Government Index (7 – 10Y) total return, 12/31/2014 – 12/31/2015 and 12/31/2012 – 12/31/2015.
If you would like to contact the editors responsible for this article, please message MarketMinder directly.
*The content contained in this article represents only the opinions and viewpoints of the Fisher Investments editorial staff.
Get a weekly roundup of our market insights
Sign up for our weekly e-mail newsletter.

You Imagine Your Future. We Help You Get There.
Are you ready to start your journey to a better financial future?

Where Might the Market Go Next?
Confidently tackle the market’s ups and downs with independent research and analysis that tells you where we think stocks are headed—and why.
Related Resources
-
Market Analysis The New Tariffs in Town Are Still Old News2026-07-24
-
Expert Commentary This Week in Review | Market Volatility, Tariffs, SpaceX
 2026-07-24
 -
Expert Commentary Why Ken Fisher Is Optimistic About European Stocks
 2026-07-23
 -
Economics A Summertime Check-in on US Consumers2026-07-23


Learn More
Learn why 210,000 clients trust us to manage their money and how Fisher Investments and its affiliates may be able to help you achieve your financial goals.
As of 6/30/2026
New to Fisher? Call Us.
Contact Us Today