Personal Wealth Management / Market Analysis
Inflation’s December Uptick in Context
Economic data—like markets—don’t move in straight lines.

Inflation ticked up a smidge in December, providing a timely gut check for sentiment: How would the investing world take headline consumer price index (CPI) inflation’s bump from 3.1% y/y to 3.4%?[i] Keeping with the broader early bull market theme, the reaction was mostly skeptical. No one said this was the start of a new surge higher, and no one dismissed it as a blip preceding a quick trip to prepandemic, below-average inflation rates. Instead, we got oodles of articles claiming it was a sign prices are stickier than first thought and the Fed has its work cut out for it as it seeks to return inflation to the target of 2% over (some undefined, squishy period of) time. Our take? It is irrational to expect economic data or markets to move in straight lines. Wiggles like this are normal. Taking them in stride is a good skill for investors to practice—especially since leading inflation indicators point to more gradual improvement ahead.
To start—and to put the latest zig in context—consider how far we have come from the near double-digit inflation spike in 2022. Exhibit 1 shows this for both headline and core (ex. food and energy) CPI. No, the round trip isn’t complete, but headline CPI has returned to its historical average neighborhood. Core inflation, while slower to hit more normal rates, has also improved markedly. And when you exclude the shelter component—which is a lagging and weird measure, as we will discuss momentarily—the improvement becomes even more apparent: Less shelter, services inflation is down from 8.2% y/y in September 2022 to 3.4% in December.[ii]
Exhibit 1: Inflation’s Arc
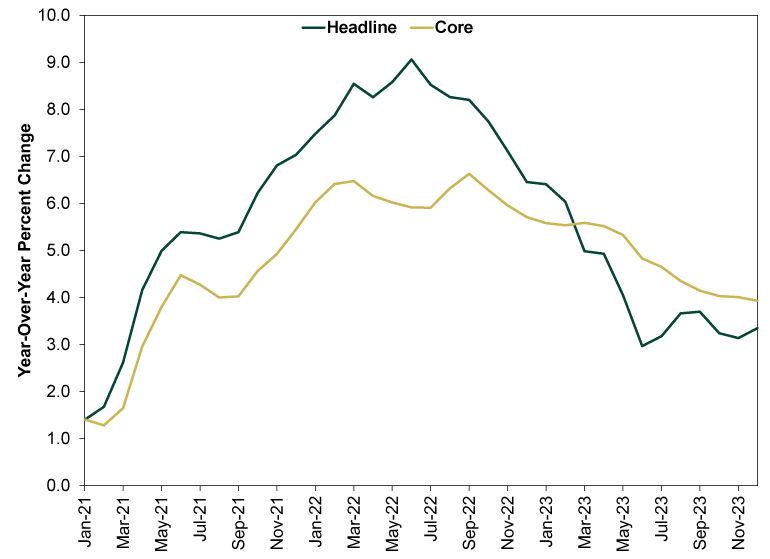
Source: FactSet, as of 1/11/2024.
Most of today’s chatter centered on core and services’ prices slower return to normal—and their elevation relative to headline prices, which benefited from sliding energy prices as commodity markets’ overreaction to the Ukraine war and sanctions reversed. The general view: Supply chain improvements brought goods prices under control, but that ship has sailed, leaving little room for improvement from here—and doing precious little for services. Thus, investors and the Fed will have to battle stickier, harder-to-vanquish prices from here.
We will award this half a point: It correctly credits supply chain factors for the improvement in goods prices, rather than falsely giving credit to the Fed, and it is realistic about where that goes from here. All is in keeping with our general observation that inflation’s improvement to date is well-known and priced in.
However, we think it is too pessimistic about prices’ future prospects, for a simple reason: Money supply. Broad M4 money supply fell year-over-year in 12 straight months through November, the latest data available. But the fall didn’t really get cooking until mid-year, and money supply changes tend to affect economic activity and prices at a lag—it takes time for goods and services prices to adjust for changes in the quantity of money chasing them. So we are probably only starting to enter the phase where one could reasonably expect falling money supply to put more of a lid on consumer prices.
Shelter prices should also continue coming back down to Earth. A big ingredient here is the aforementioned lagging and weird component, owner’s equivalent rent (OER). This is the hypothetical amount a homeowner would pay to rent their own house. No one actually pays it, and it doesn’t exist in the real world. It is an attempt to incorporate home prices into inflation. We guess we get why statisticians would want to do this, but homes are an asset, not a good or service, and it isn’t like stocks and bonds are in CPI. So we think it is a questionable input. But it is an input nonetheless—and one that should continue to improve, given it tends to lag real-world home prices by a year and a half. With mortgage rates easing and supply coming back on the market, home prices should continue stabilizing, eventually flowing through to OER. Actual rents, too, should improve as supply rises.
The best part of this for investors is that with skepticism lingering, there is still room for inflation improvement to help propel stocks up the wall of worry. Nowhere near as much room as there was a year or so ago—again, Exhibit 1 is well-known. Pre-priced. Market-based inflation expectations are also down. But it doesn’t seem to us that investors yet fully fathom that the road ahead doesn’t depend on the Fed nailing rates perfectly, or the economy slowing, or wages sagging, or or or. With that skepticism is room for reality to beat expectations, even if just modestly. It is a brick in the wall of worry. Only one brick, but every brick counts.
If you would like to contact the editors responsible for this article, please message MarketMinder directly.
*The content contained in this article represents only the opinions and viewpoints of the Fisher Investments editorial staff.
Get a weekly roundup of our market insights
Sign up for our weekly e-mail newsletter.

You Imagine Your Future. We Help You Get There.
Are you ready to start your journey to a better financial future?

Where Might the Market Go Next?
Confidently tackle the market’s ups and downs with independent research and analysis that tells you where we think stocks are headed—and why.
Related Resources
-
Politics Blunting Burnham?2026-07-21
-
Market Analysis Why the SOX “Bear Market” Isn’t Foreboding2026-07-21
-
Expert Commentary 3 Things You Need to Know This Week | Q2 Earnings, ECB Meeting, Trump Accounts
 2026-07-20
 -
Weekly Wrap-Up Fisher Investments Reviews: Last Week in Markets—July 13 - July 172026-07-20


Learn More
Learn why 210,000 clients trust us to manage their money and how Fisher Investments and its affiliates may be able to help you achieve your financial goals.
As of 6/30/2026
New to Fisher? Call Us.
Contact Us Today