Personal Wealth Management / Market Analysis
Putting Western Money Supply Dips Into Context
Monetary measures remain well above prepandemic trends.

The Western world’s contracting money supply is garnering ever more attention, and we can’t decide if we are surprised or not. We sort of are, since monetarism went out of fashion with bootcut jeans in the 2000s (if not sooner). And we sort of aren’t, since when sentiment is this low, investors tend to pile on to anything that looks a bit gloomy. At any rate, broad money has been slipping for months in the US, UK and eurozone, ratcheting up recession chatter. While we agree it is worth watching, we see some mitigating circumstances and don’t view this as reason to believe stocks’ economic drivers are weakening.
In a vacuum, falling money supply is typically bad news for the economy. After all, money creation and swift velocity are the lifeblood of new economic activity. We worded that as a general statement, but there is well over a century’s worth of data and rhetoric to back it up, and if it weren’t a copyright violation, we would take pictures of the pretty charts in Wesley Clair Mitchell’s Business Cycles and Milton Friedman and Anna Jacobson Schwartz’s A Monetary History of the United States, 1867 – 1960 to prove it. But they showed, with numbers and pictures and words, that rising money supply often accompanies prosperity and declining money supply usually breeds bad times.
But those statements aren’t absolutes and we think it is too simplistic to equate falling money supply with danger this time. For one, the declines are very small thus far. The Center for Financial Stability’s US M4 gauge, the broadest measure available, is off just -1.0% y/y—a slower pace of decline than April’s—and nearly matching eurozone M3.[i] UK M4 is down a bit more, -4.1% y/y, but there is some base effect skew from a two-month jump in September and October 2022.[ii]
But also, context matters, and the nascent, small slip follows huge monetary spikes during COVID lockdowns—the very ones that triggered 2022’s hot inflation. The massive wall of money central banks pushed into the system is still there, a lasting COVID-related dislocation in our economy.
To show this, we are going to do something we usually don’t do: show you charts with trendlines. We normally thumb our nose at such things, which imply averages have gravitational pull—not true, in our view. But in this case, we think comparing actual money supply to an extension of pre-pandemic growth rates is a good illustration of a counterfactual. Looking at the US, UK and Europe, we see that even with the nascent declines, money supply remains well above the pre-pandemic trend. In our view, this is compelling evidence that—rather than being a big negative—the declines are part of a late-lagging return to normal.
Exhibit 1: US M4 Money Supply Versus the Pre-COVID Trend
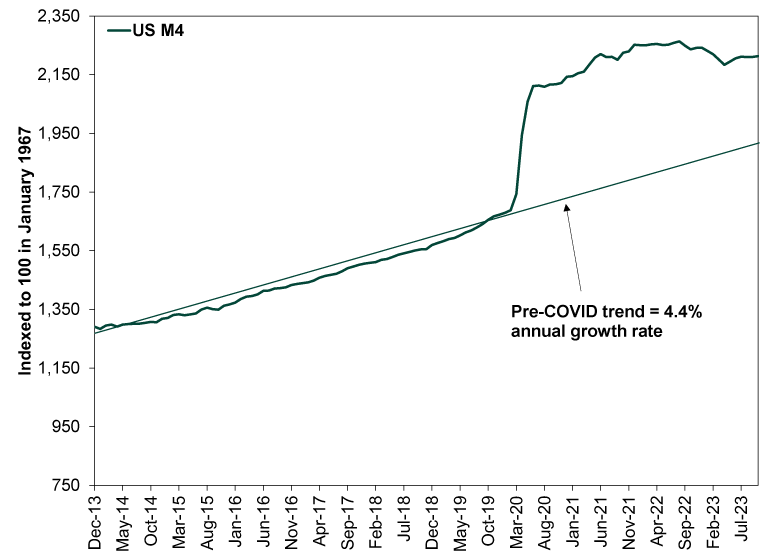
Source: Center for Financial Stability, as of 12/6/2023. Divisia M4 (index), December 2013 – October 2023.
Exhibit 2: UK M4 Money Supply Versus the Pre-COVID Trend
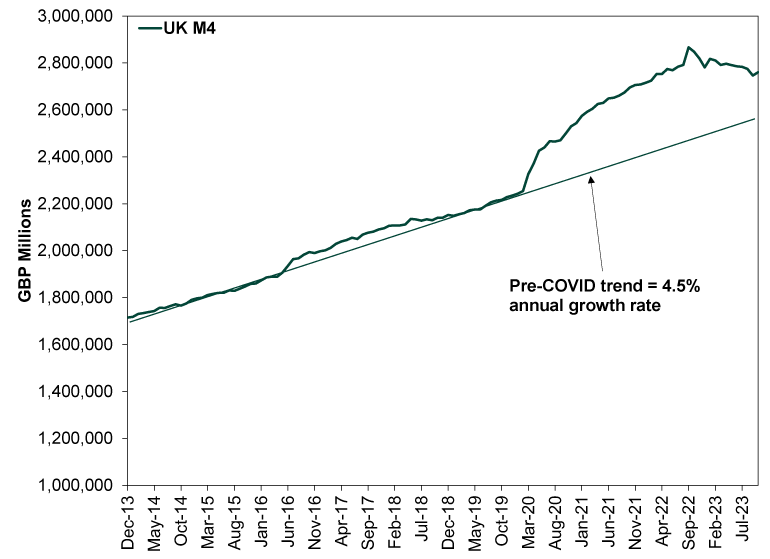
Source: Bank of England, as of 12/6/2023. M4 Excluding Intermediate OFCs, December 2013 – October 2023.
Exhibit 3: Eurozone M3 Money Supply Versus the Pre-COVID Trend
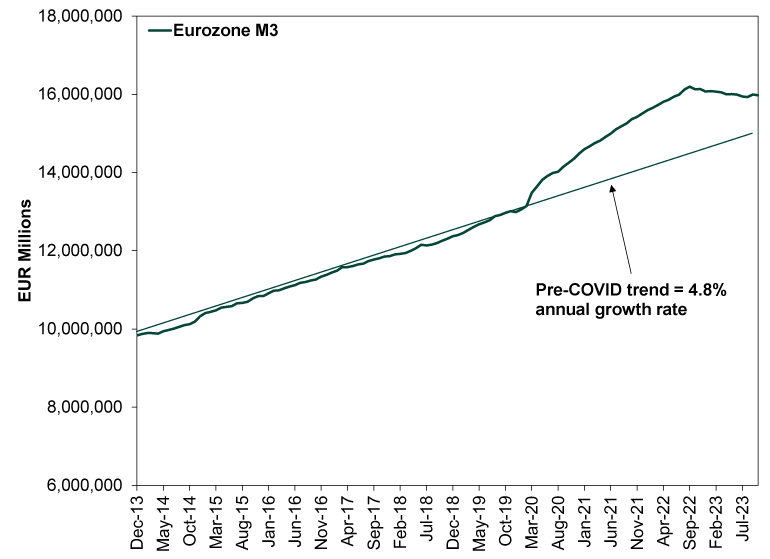
Source: FactSet, as of 12/6/2023. Eurozone M3, December 2013 – October 2023.
Still, we do think the situation bears watching. If the drop worsens or pairs with a lending freeze as bank funding costs rise, it could put a big strain on things. But for now at least, that doesn’t appear to be the case, and with so many eyeballs on this, surprise power is minimal. Markets probably started discounting it before people caught on, and they have been rising on both sides of the Atlantic. So for the moment, we suggest simply appreciating the small monetary contraction as a disinflationary force that should help keep prices in check from here.
If you would like to contact the editors responsible for this article, please message MarketMinder directly.
*The content contained in this article represents only the opinions and viewpoints of the Fisher Investments editorial staff.
Get a weekly roundup of our market insights
Sign up for our weekly e-mail newsletter.

You Imagine Your Future. We Help You Get There.
Are you ready to start your journey to a better financial future?

Where Might the Market Go Next?
Confidently tackle the market’s ups and downs with independent research and analysis that tells you where we think stocks are headed—and why.
Related Resources
-
Market Analysis The New Tariffs in Town Are Still Old News2026-07-24
-
Expert Commentary This Week in Review | Market Volatility, Tariffs, SpaceX
 2026-07-24
 -
Economics A Summertime Check-in on US Consumers2026-07-23
-
Expert Commentary Why Ken Fisher Is Optimistic About European Stocks
 2026-07-23


Learn More
Learn why 210,000 clients trust us to manage their money and how Fisher Investments and its affiliates may be able to help you achieve your financial goals.
As of 6/30/2026
New to Fisher? Call Us.
Contact Us Today