Personal Wealth Management / Market Analysis
Shhh … Elevated Inflation Rates Still Look ‘Transitory’
Pundits and policymakers alike seem fooled by statistical skew in September’s CPI.

Transitory – adjective.
‘tran-zә-tȯr-ē
Definition:
- Of brief duration; temporary
- Tending to pass away; not persistent[i]
Those are the two definitions Merriam Webster’s dictionary offers for transitory, but it seems Atlanta Fed President Raphael Bostic wants to add an interpretation to the above: a … shhh … “swear word.”[ii]
It isn’t, of course.[iii] But on the heels of Wednesday’s US consumer price index (CPI) release for September—which exceeded estimates with a 5.4% y/y rise—pundits and policymakers are increasingly questioning whether elevated inflation rates are really so transitory (oops).[iv] But in our view, most signs point to the recent spate of high year-over-year readings fading before long, including the September CPI’s details.
First, so that we are clear, when we use the term transitory, we aren’t suggesting CPI will turn negative and erase the uptick we have seen in recent months. Rather, we are suggesting the currently elevated, year-over-year rate of change noted above won’t persist far into the future. Inflation should slow; the rate of price increases should fall. So perhaps Fed officials’ error in deploying the term was being unclear in using it.
Still, we continue to believe that, using this definition of the forbidden term, hot inflation will prove to be of brief duration, subsiding to rates more akin to the sub-2% year-over-year pre-pandemic rates most pundits decried as too slow. The difference isn’t semantic. Prices compounding at a non-transitory (sorry) 2% rate for years on end have a very, very different effect than prices compounding at 5%. Exhibit 1 shows you a hypothetical change in prices of a $100 widget over 10 years’ time at these two consistent rates.
Exhibit 1: Hypothetical Effect of Two Inflation Rates on Prices
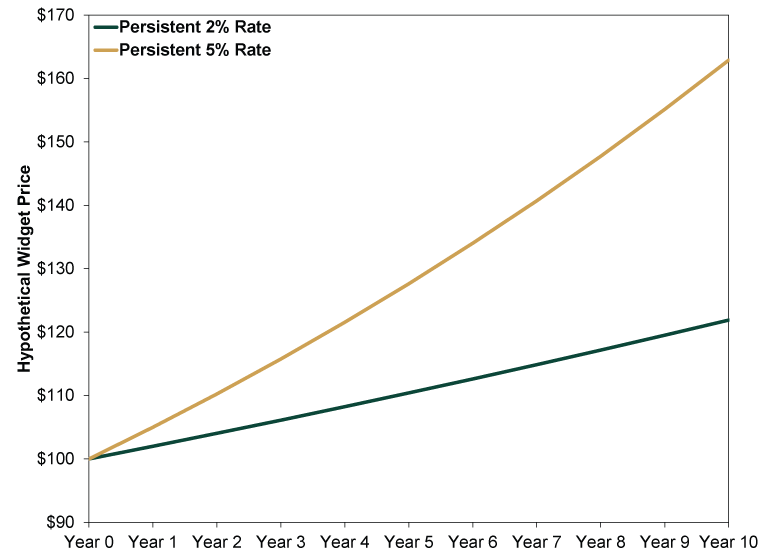
Source: Math and Microsoft Excel, as of 10/13/2021.
So the pertinent question, in our view, is: Do the currently elevated inflation rates last or fade? We have long argued the latter, and we see little here that changes our opinion.
To see why, dig into the data a little deeper. First, to use what is another inflation-related curse word to many, core CPI—prices excluding food and energy—rose 4.0% y/y, matching August’s rate. (Exhibit 2)
Exhibit 2: Headline and Core CPI
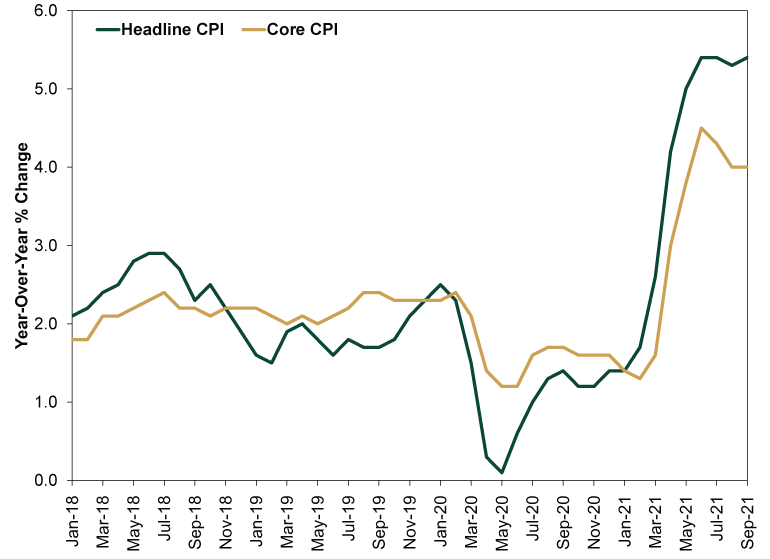
Source: US Bureau of Labor Statistics, as of 10/13/2021. January 2018 – September 2021.
Yes, we realize that you must buy food and energy to survive, so excluding them may not really reflect your spending. However, the CPI doesn’t aim to do that anyway. It is supposed to be a broad measure of price movement across the economy—something to help guide economic policymakers. The trouble with food and energy prices is that they are quite volatile, with swings often resulting from factors like weather—beyond the influence of policy. Furthermore, as we have discussed here several times, you must consider base-effect skew in year-over-year data.
While that is mostly behind us for the overall headline rate, various major categories—energy prices in particular—are still showing big base effects from last year’s lockdown-induced depressed levels. (Exhibit 3) They aren’t the only ones. The year-over-year change in prices for “food at home”—groceries—also shows a lagged base effect. These prices jumped during and just after lockdowns, but they fell back during summer and fall 2020. That is now the denominator used in calculating the food prices’ impact on the headline year-over-year rate, skewing the data.[v] It is somewhat ironic that, despite policymakers and pundits going to great lengths to warn correctly of statistical skew in CPI in the spring, they are now chucking the lesson out the window just when the world needs it.
Exhibit 3: Energy Prices Still Showing Base-Effect Skew
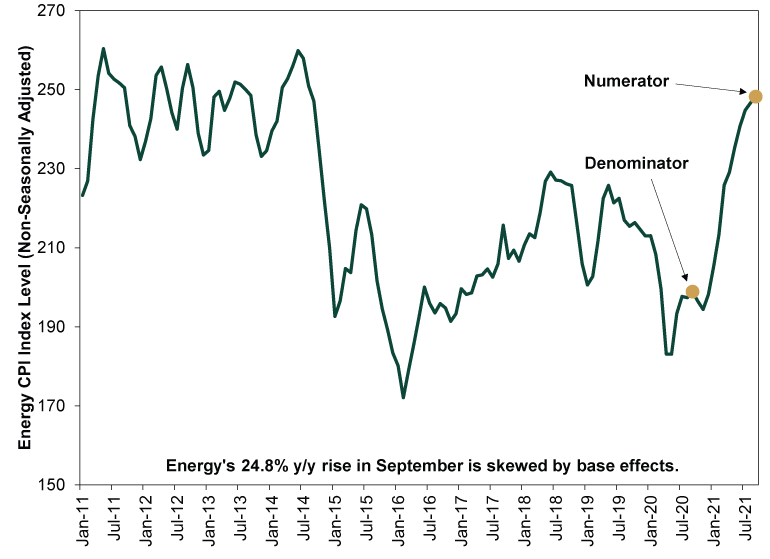
Source: US Bureau of Labor Statistics, as of 10/13/2021. January 2011 – September 2021.
We think it remains more telling to look past the big year-over-year numbers that inspire most coverage and focus on the trend in month-over-month data. These tell a more interesting story in our view—one of moderating price increases. (Exhibit 4)
Exhibit 4: Headline and Core CPI Moderation
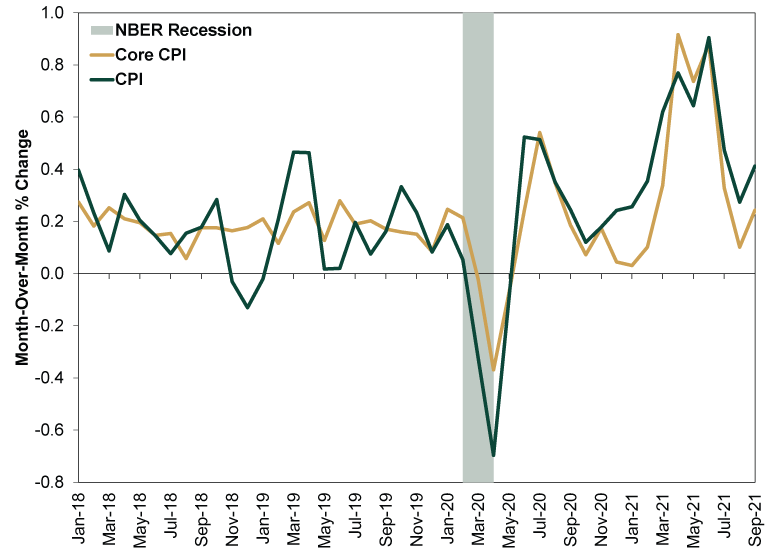
Source: Federal Reserve Bank of St. Louis, as of 10/13/2021. January 2018 – September 2021. Recession dating as per the National Bureau of Economic Research, the official arbiter of American business cycles.
Viewed that way, the elevated inflation we have seen in recent months actually does look transitory. (There is that word again. We must wash our mouths out with soap.) Some choppiness should be expected, and it will take longer for lingering base effects in various underlying series to fall out of the data. But we think it remains a mistake to extrapolate today’s elevated surface-level, year-over-year inflation rates forward. All in all, today’s increasingly common fears of lasting, hot inflation rates look false—which should be a source of relief and positive surprise as this unfolds in the coming months, in our view.
[i] Source: Merriam-Webster, as of 10/13/2021.
[ii] “Transitory Is ‘Dirty Word’ as Inflation Lasts, Bostic Says,” Steven Matthews, Bloomberg, 10/13/2021.
[iii] Nor does it have the meter of a typical expletive. Too many syllables, we figure.
[iv] Source: US Bureau of Labor Statistics, as of 10/13/2021.
[v] To be clear: This doesn’t explain the entire uptick in food prices. But it is a powerful contributor to it.
If you would like to contact the editors responsible for this article, please message MarketMinder directly.
*The content contained in this article represents only the opinions and viewpoints of the Fisher Investments editorial staff.
Get a weekly roundup of our market insights
Sign up for our weekly e-mail newsletter.

You Imagine Your Future. We Help You Get There.
Are you ready to start your journey to a better financial future?

Where Might the Market Go Next?
Confidently tackle the market’s ups and downs with independent research and analysis that tells you where we think stocks are headed—and why.
Related Resources
-
Market Analysis On the June Inflation Cooldown2026-07-14
-
Expert Commentary 3 Things You Need to Know This Week | US Inflation, China GDP, US Retail Sales
 2026-07-13
 -
Weekly Wrap-Up Fisher Investments Reviews: Last Week in Markets—July 6 - July 102026-07-13
-
Expert Commentary This Week in Review | Global PMIs, SpaceX, RMD Planning
 2026-07-10


Learn More
Learn why 210,000 clients trust us to manage their money and how Fisher Investments and its affiliates may be able to help you achieve your financial goals.
As of 6/30/2026
New to Fisher? Call Us.
Contact Us Today