Personal Wealth Management / Market Analysis
Six Years On, the Bull Stays Strong
Six years into the bull, stocks look set to keep clocking all-time highs.

Like Tom Hanks' character in Big, this bull market isn't as old as a casual observer might think. Photo by 20th Century-Fox/Getty Images.

Six years ago today, global stocks hit bottom. The bear was brutal; painful; there was blood in the streets. The next day, Ben Bernanke told the Council on Foreign Relations that regulators were considering suspending fair-value accounting rules for banks' illiquid assets. Markets rose, hoping the toxic accounting rule that spiraled a couple hundred million in loan losses into nearly $2 trillion of paper losses and sheer financial panic would soon die. While it surely wasn't clear to many, a bull market was born. It hasn't been smooth, but 191% later, world stocks are at all-time highs and rising-and look set to keep chugging.[i] Whether you've been in stocks the whole time or are new to the fray, the party isn't ending-we expect more good times ahead.
This bull might feel long in the tooth, but it isn't abnormally old-and bulls don't die because of age alone. The 12 full S&P 500 bull markets since 1929 averaged 57 months, but some ran longer. At 72 months, this bull is still younger than the 1949-1956, 1974-1980 and 1990-2000 bull markets. It also isn't abnormally big. Since the bottom, the S&P 500 is up 252%.[ii] Also above-average (165%), but smaller than the 1932-1937, early-mid 1950s and 1990s bulls. More gains from here wouldn't be unprecedented, not that even the biggest or longest represent some kind of a limit to growth.[iii]
Nor would more all-time highs. The MSCI World Index has hit 75 new record highs during this bull. The S&P 500 has 145. Sound big? The S&P hit a few hundred more in the 1990s bull. The 1980s bull also had more records. Bull markets routinely hit new highs-par for the course when stocks generally move up and to the right over time. Records aren't meaningful. Nor are round numbers, like Dow 18,000 or S&P 2000. They are numbers. Our pattern-seeking and milestone obsessed brains want them to mean something! But they're just arbitrary factoids. Measures of past performance, which never tells you what's ahead.
Some argue valuations say the end is nigh as the S&P 500 and MSCI World's price-to-earnings (P/E) ratios are above their long-term averages. But P/Es normally expand as bull markets age and sentiment improves. Stocks don't have some inherent fair value. There is no "right" relationship between stock prices and earnings growth. Stocks are always and everywhere worth what the market is willing to pay for them. As sentiment improves and investors gain confidence, they become more willing to pay more to own a share in publicly traded firms' future earnings. So P/Es rise. In industry lingo, we call this multiple expansion-stocks trade at bigger and bigger multiples of earnings. Mature bull markets usually see long stretches of multiple expansion. We haven't seen much yet this time around (Exhibit 1), which suggests sentiment has a ways to go before investors' expectations get out of whack.
Exhibit 1: High P/Es Are Normal During Maturing Bull Markets
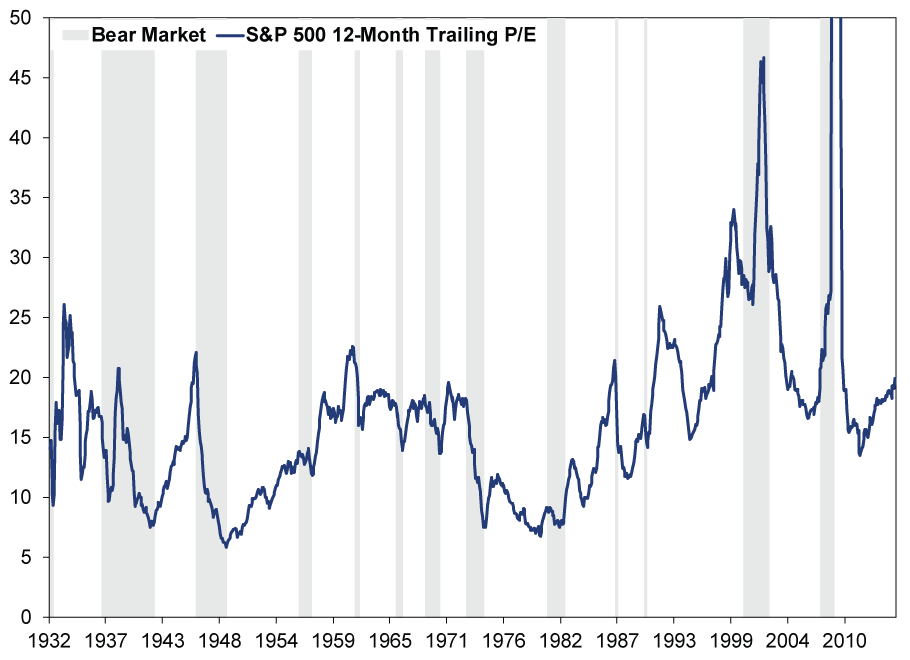
Source: FactSet and Multpl.com, as of 3/6/2015. S&P 500 12-Month Trailing P/E Ratio, 1/1/1932 - 3/5/2015.
Others fear the S&P 500's high cyclically adjusted P/E (CAPE) means investors are irrationally exuberant, but this doesn't hold up. CAPE, which compares the market's price to the last 10 years of inflation-adjusted earnings, is uselessly backward-looking. It claims to predict the next 10 years-an impossible task-not cyclical turning points, but it is rubbish at both. Stocks move on the gap between expectations and reality looking forward. P/Es measure the gap between prices today and the bizarrely smoothed reality over the last 10 years, which is skewed by recessions and recoveries alike. That tells you nothing about what happens from here. Past stock performance doesn't predict future performance. Past earnings don't predict future earnings. CFOs do not draft business plans by extrapolating the last 10 years of earnings into the next 10 and calling it a day. That is intellectually lazy, just like CAPE. Also! Its creators like to boast its prescience in 2000 (as they warn it is at similar levels today), but it was at those allegedly bearish levels for over one-third of the 1990s bull (Exhibit 2).[iv] It hit them in mid-1996. Were stocks really irrationally exuberant more than three years before the bull ended?
Exhibit 2: CAPE Is Useless
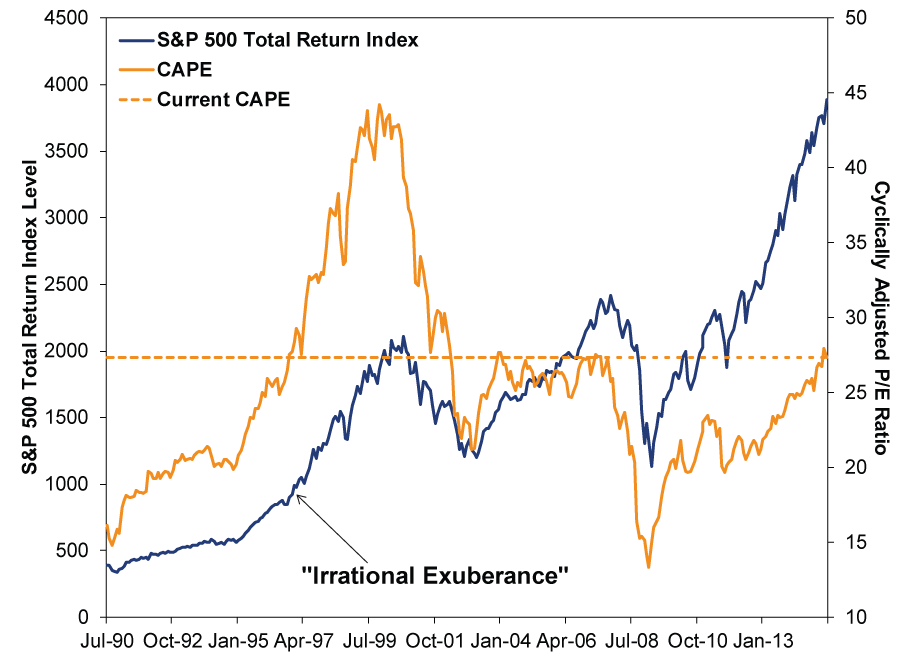
Source: FactSet and Multpl.com, as of 3/6/2015. S&P 500 Total Return Index and Cyclically Adjusted P/E Ratio, 6/30/1990 - 3/5/2015.
Stocks today aren't looking backward. They don't care about valuations, the number of all-time highs, how far they climbed since March 9, 2009 or the fact they've been climbing since then. What do they care about? Whether the world economy and political backdrop will allow publicly traded firms to keep doing better than people expect! Right now, those drivers point to more bull ahead. The world economy is growing and broadly beating expectations in advanced and Emerging Markets alike. Leading Economic Indexes (LEI) in most major economies are high and rising-swiftly in America and China, unevenly in Europe and other nations. No recession in 55 years-US LEI's entire published history-has begun during an LEI uptrend. LEI usually falls for some time before the broader economy turns. As for politics, most Western nations are gridlocked-a plus. It means legislatures can't easily wreck property rights or alter the distribution of resources and capital in the world's most competitive nations, like the US, UK, Germany and Canada. And sentiment, though growing optimistic, is well short of euphoria. Headlines still search for bad news wherever they can find it. Fear of heights is rampant. Bearish pundits get respect, not ridicule. The prior three sentences will not be true when the bull peaks.
Don't get me wrong, there will be volatility, perhaps even a correction. But overall, this bull looks set to keep on running, hitting many more new highs before the next bear rears its ugly head. Enjoy the ride.
Beat the Crowd, by Ken Fisher with Elisabeth Dellinger, is available for pre-order on Amazon.com. Order your copy today!
[i] FactSet, as of 3/6/2015. MSCI World Index returns with net dividends, 3/9/2009 - 3/5/2015.
[ii] FactSet, as of 3/6/2015. S&P 500 Total Return Index, 3/9/2009 - 3/5/2015.
[iii] There isn't one, as the failure of the Club of Rome's 1972 book The Limits to Growth ironically demonstrates.
[iv] Last June, for instance, one argued the S&P 500 "looks like a peak" because CAPE matched 2000's level. Stocks did not peak then.
If you would like to contact the editors responsible for this article, please message MarketMinder directly.
*The content contained in this article represents only the opinions and viewpoints of the Fisher Investments editorial staff.
Get a weekly roundup of our market insights
Sign up for our weekly e-mail newsletter.

You Imagine Your Future. We Help You Get There.
Are you ready to start your journey to a better financial future?

Where Might the Market Go Next?
Confidently tackle the market’s ups and downs with independent research and analysis that tells you where we think stocks are headed—and why.
Related Resources
-
Politics Blunting Burnham?2026-07-21
-
Market Analysis Why the SOX “Bear Market” Isn’t Foreboding2026-07-21
-
Expert Commentary 3 Things You Need to Know This Week | Q2 Earnings, ECB Meeting, Trump Accounts
 2026-07-20
 -
Weekly Wrap-Up Fisher Investments Reviews: Last Week in Markets—July 13 - July 172026-07-20


Learn More
Learn why 210,000 clients trust us to manage their money and how Fisher Investments and its affiliates may be able to help you achieve your financial goals.
As of 6/30/2026
New to Fisher? Call Us.
Contact Us Today