Personal Wealth Management / Market Analysis
Surveys and Numbers and Charts! Oh My!
Global economic growth is alive and well.

DATA!
Yes, that is a sad attempt to get you jazzed for a piece full of numbers and charts.[i] We will do our best to make it interesting, with jokes aplenty, for the blizzard of numbers out this week-and how headlines interpreted it-reveals much about how many underestimate the economy. Sure, there are a couple weak spots, but overall, expansionary signs are all around. The world economy is in better shape than many perceive-great for stocks.[ii]
Because we are not Pollyannas, we will lead with the main weak spot: factory orders, which fell -0.4% in April, the eighth decline in nine months, as many, many, many, outlets pointed out, some bemoaning the dollar and weak oil prices (oddly, considering orders from the oil industry rose). Excluding transportation orders, orders were basically flat at 0.02% growth. Excluding defense, they were also basically flat, down -0.03%. The Census Bureau rounds both to zero, which seems apropos to us. Here, it is tempting to hit you with a flurry of yah-buts. As in "yah, but, orders for machinery, fabricated metals and primary metals rose!" Or "yah, but, the -0.3% drop in core capital goods orders followed a nice 1.6% pop in March!" Or "yah, but orders for motor vehicles and parts rose, so go cars go!" But we have no problem calling a spade a spade. This report isn't so grand. Nor is the trend. But here is a fun (?) little secret: This not-so-good-on-the-surface trend has been in place since December 2011 (Exhibit 1). Yet business investment kept clocking new highs (Exhibit 2). So did GDP. So did stocks. One long-wobbly input won't make or break anything.
Exhibit 1: Factory Orders During This Expansion
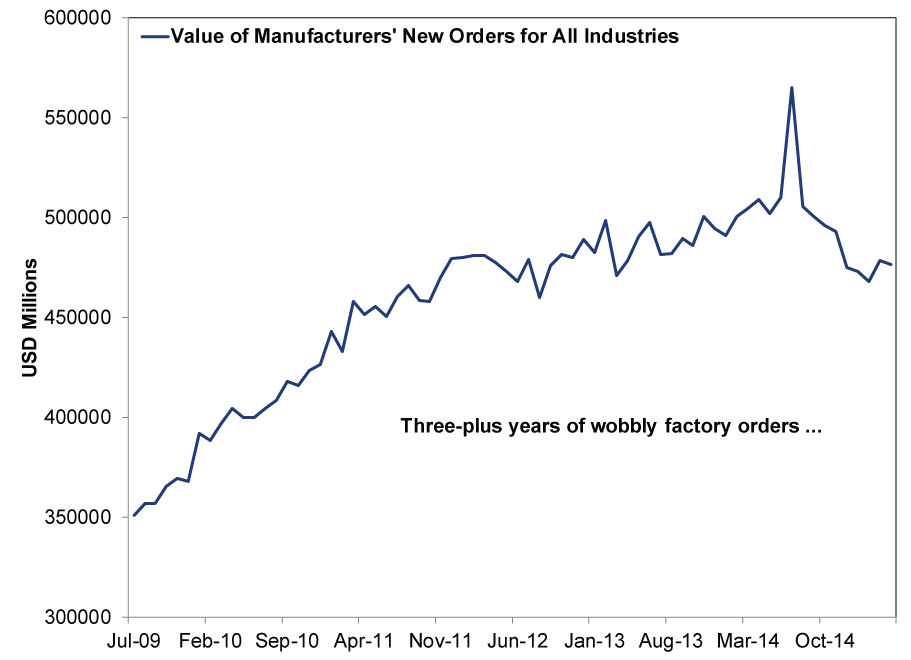
Source: Federal Reserve Bank of St. Louis, as of 6/4/2015. Value of Manufacturers' New Orders for All Industries, July 2009 - April 2015.
Exhibit 2: Business Investment During This Expansion
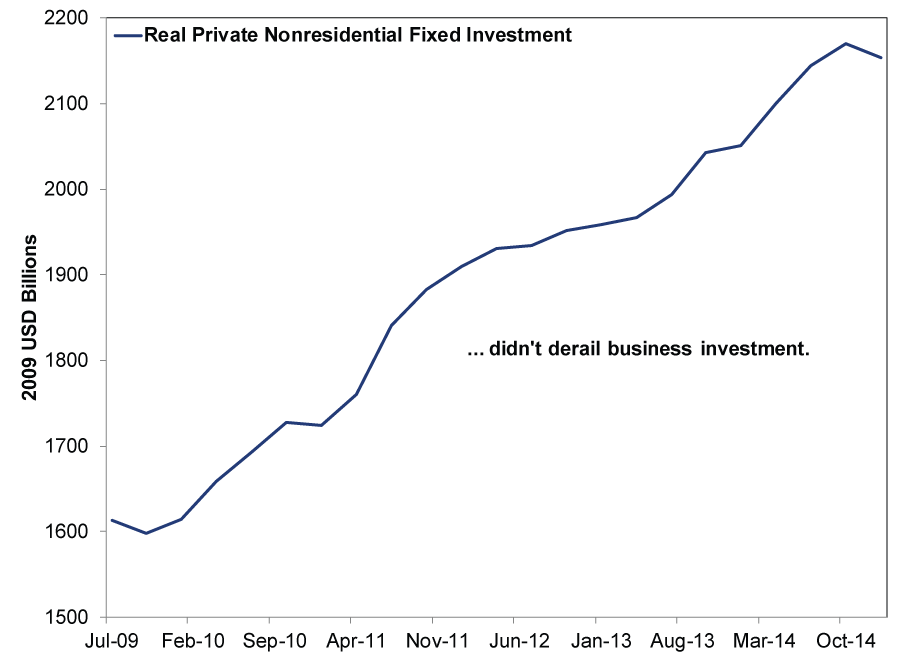
Source: Federal Reserve Bank of St. Louis, as of 6/4/2015. Real Private Nonresidential Fixed Investment, Q2 2009 - Q1 2015.
So that's what happened in April-"what happened in May?" you might ask. Glad you asked! The Institute of Supply Management (ISM) gave us the first glimpse this week, courtesy of their monthly surveys on business activity: the Manufacturing and Non-Manufacturing Purchasing Managers' Indexes, or PMIs.[iii] Near the start of every month, ISM sends surveys to a few hundred businesses, asking them to say whether they experienced growth or declines in 10 categories in that month. Respondents fill them out when they fill them out-ideally toward the end of the month, but it varies-and then ISM calculates the percentage reporting growth. Hence any readings over 50 are deemed "expansion," and readings under 50 are supposedly "contraction." Both surveys topped 50 in May-52.8 for manufacturing and 55.7 for non-manufacturing. Both surveys' New Orders Indexes-which, as the name implies, measures new business-were also expansionary: 55.8 for manufacturing new orders, 57.9 for services new orders.
We'd leave it at that and tell you this is a rough indication economic activity grew in May, but most pundits are not content to leave it at that. They read into the monthly fluctuations and argue growth accelerated if the number rose or slowed if the PMI fell-and thus bemoaned the fact Non-Manufacturing PMI hit a 13-month low. It all strikes us as a bit presumptive. As you likely gleaned from the above paragraph, PMIs measure the breadth of growth-how widespread it was. They don't measure the magnitude of growth. So color us skeptical that Non-Manufacturing PMI's fall from April's 57.8 to 55.7 means growth actually slowed. If the 55.7% of firms reporting growth last month grew faster, then growth overall could have accelerated. Weakness was also concentrated in the mining industry, the only one reporting contraction-a well-known result of oil prices' fall. All service-based industries reported growth.
Surveys are not airtight. They are rough estimates, useful for their timeliness.[iv] Don't get bogged down in their wobbles-if the trend of the headline PMIs and New Orders Indexes is above 50, we're probably in good shape. Those trends have indeed been above 50 for years now, despite all them wobbles, and we have had a lot of growth during those years.
Exhibit 3: Composite PMIs During This Expansion
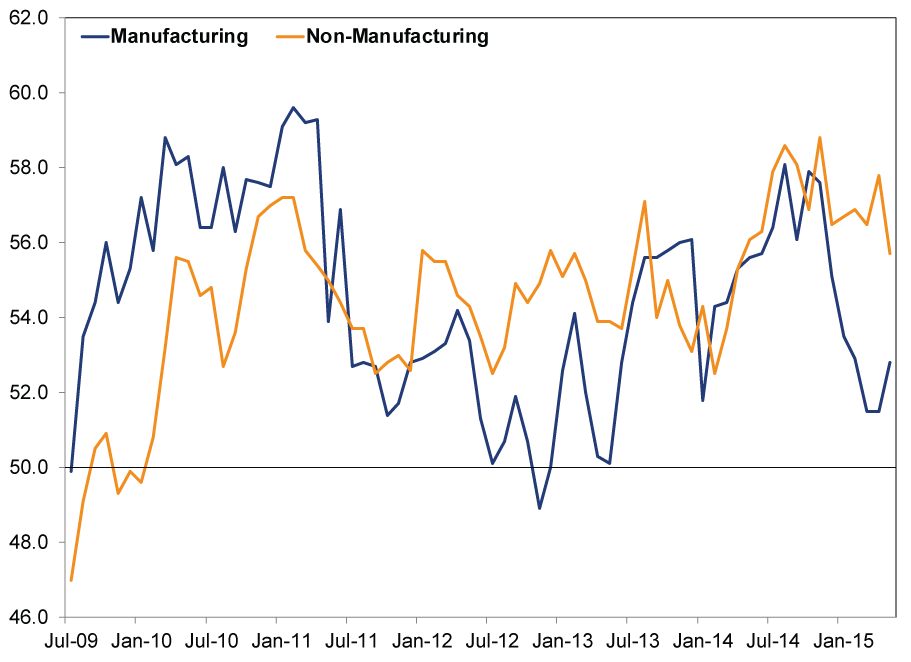
Source: Source: Federal Reserve Bank of St. Louis, as of 6/4/2015. ISM Manufacturing Composite PMI and Non-Manufacturing Composite NMI, July 2009 - May 2015.
Exhibit 4: New Orders[v] During This Expansion
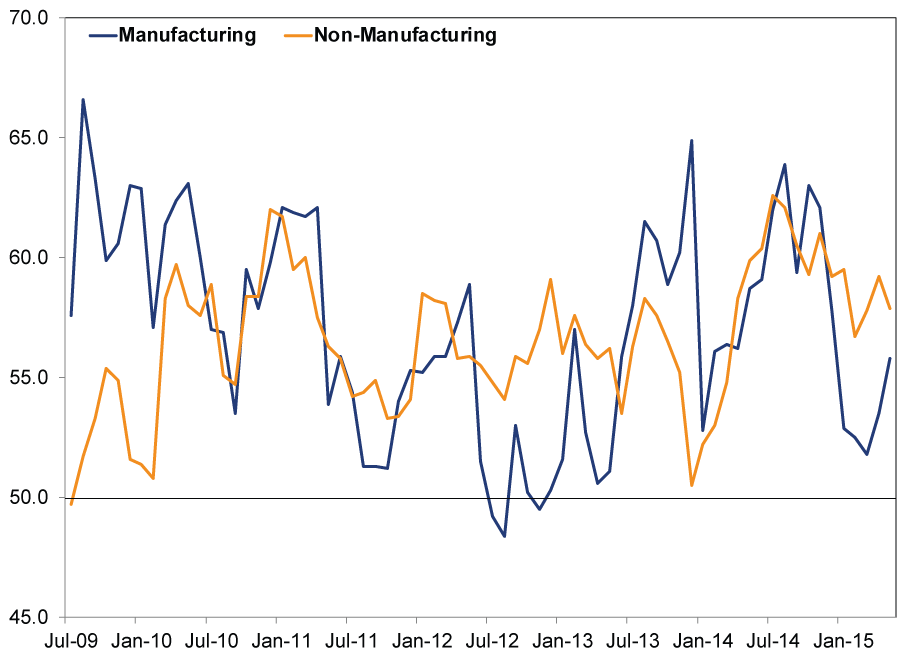
Source: Source: Source: Federal Reserve Bank of St. Louis, as of 6/4/2015. ISM Manufacturing and Non-Manufacturing New Orders Indexes, July 2009 - May 2015.
Same philosophy goes for all the European PMIs out this week, of which there were many. So many that we won't even try to string them into a narrative, because we don't want to make you tired. So here are some tables.
Exhibit 5: European Manufacturing PMIs - May
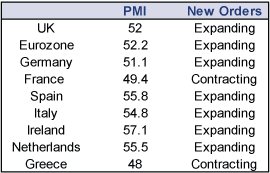
Source: Markit Economics, as of 6/4/2015.
Exhibit 6: European Service PMIs - May
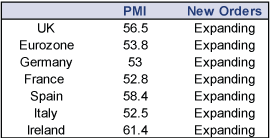
Source: Markit Economics, as of 6/4/2015
Some slowed, others sped, but none diverged from their longer-term trends of growth or contraction. All these countries have service-based economies, so the fact service growth was broader than manufacturing growth bodes well. France's Manufacturing PMI has contracted a while now, yet France keeps growing. All in all, these latest numbers are consistent with continued expansion in the UK and more uneven growth in the eurozone. Except Greece.
Same goes for the world! JP Morgan's global PMIs were all above the magic growth line in May. So was new business. Global growth, baby!
Exhibit 7: JP Morgan's Global PMIs - May

Source: Markit Economics, as of 6/4/2015.
Of course, May was last month, which is in the past, and stocks are not backward-looking. They are forward-looking! The preceding 802 words[vi] and seven pictures mostly just put some numbers and perspective on what stocks have already lived through and probably already discounted. Of most use to investors are forward-looking indicators. The new orders indexes are forward-looking, as today's orders become tomorrow's production, so broad-based expansion is a good sign growth will continue. The Conference Board's Leading Economic Indexes (LEI) are an even better gauge. There are 13, covering big developed and emerging economies and the eurozone. The oldest is the US LEI, which has a 55-year published history. In that span, no recession has begun while LEI was high and rising, as it is today. The other LEIs, though newer, are similarly accurate. And here is what the biggest ones look like:
Exhibit 8: Select LEIs
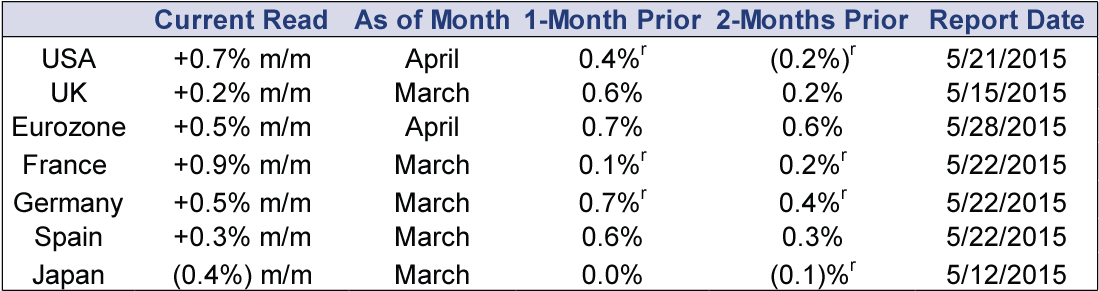
Source: The Conference Board, as of 5/22/2015. Negative reads are in parentheses. r denotes revised data.
More growth! At a time the OECD, IMF and many pundits are worried about where the economy is heading. That tells you sentiment still lags reality, giving stocks more "wall of worry" to climb.
[ii] But terrible for whimsy.
[iii] The non-manufacturing one is actually the Non-Manufacturing Index, or NMI, but we call it a PMI because the methodology is the same and we don't want to confuse you with acronym overload. Hopefully this footnote isn't TMI, which is an acronym for "too much information." Yes, we are gunning for yuks and LOLs 24/7.
[iv] We thought about adding a terrible analogy calling them the Polaroid camera of surveys. But we love Polaroids and didn't want to give you the impression we don't. Long live the Polaroid.
[v] We thought about doing one chart for the manufacturing stuff and one for the non-manufacturing instead, but we thought this breakdown had more substance.
[vi] Not including chart titles or source notes. Just in case you decided to count.
If you would like to contact the editors responsible for this article, please message MarketMinder directly.
*The content contained in this article represents only the opinions and viewpoints of the Fisher Investments editorial staff.
Get a weekly roundup of our market insights
Sign up for our weekly e-mail newsletter.

You Imagine Your Future. We Help You Get There.
Are you ready to start your journey to a better financial future?

Where Might the Market Go Next?
Confidently tackle the market’s ups and downs with independent research and analysis that tells you where we think stocks are headed—and why.
Related Resources
-
Market Analysis The Politics and Practicalities of the Social Security Trust Fund2026-06-16
-
Market Analysis Gold Fails the Safe Haven Test Again2026-06-16
-
Weekly Wrap-Up Fisher Investments Reviews: Last Week in Markets—June 8 - June 122026-06-15
-
Market Analysis A Market Perspective on Iran Truce Whisperings2026-06-15


Learn More
Learn why 200,000 clients trust us to manage their money and how Fisher Investments and its affiliates may be able to help you achieve your financial goals.
As of 3/31/2026
New to Fisher? Call Us.
Contact Us Today