Personal Wealth Management / Market Analysis
That Dog of a Dow
Properly constructed indexes are leaving the Dow in the dust this year.

Has the rally stalled? Financial headlines coast to coast seem stuck in a malaise, implying stocks are struggling through an L-shaped recovery after last October’s low. You would be hard pressed to know the S&P 500 is up 10.1% year to date (through Thursday’s close) and 18.6% since October 12.[i] Nor that global stocks are up 10.0% year to date and 21.2% since the low.[ii] We suspect there is a simple reason for this, one The Wall Street Journal also hit on Friday: Most commentary references the Dow Jones Industrial Average, which is struggling and up a measly 1.2% this year.[iii] In our view, the focus on this broken index—not to mention its 2023 returns in a vacuum—probably deserves a good chunk of the credit for the continued pessimism.
The Dow has oodles of sentimental value due to its history—the first attempt to broadly measure the stock market—but let us be clear: That is about the extent of its worth. With only 30 stocks, it doesn’t accurately reflect the broad US economy and the thousands of publicly traded companies that participate in it. It weights its constituents by share price rather than market value, giving some very small companies outsized influence over its returns, while downplaying some huge firms. It omits reinvested dividends, which are a large source of long-term compound returns for folks in the real world (especially decades ago, when dividend yields were overall higher). We get why it exists—early investors needed an easy way to measure the market’s returns with just a pen and paper—but we have computers and powerful software now. Hence, we also have broad, market cap-weighted indexes like the S&P 500 for the US and the MSCI World Index for the world, both of which include reinvested dividends (aka total returns).
Year-to-date returns are one way to see the impact. But looking a bit further back, to the recovery’s start last October (which we think looks increasingly like a new bull market’s start), is perhaps even more helpful. Exhibit 1 does this, showing the Dow, the S&P 500 Price Index (without dividends), and the S&P 500 Total Return Index, all indexed to 100 at market close on October 12. Before sliding sideways this year, the Dow bounced highest and fastest off the low, while the S&P 500’s rally started slower but had more staying power, with reinvested dividends adding more returns as time progressed.
Exhibit 1: A Tale of Three Indexes
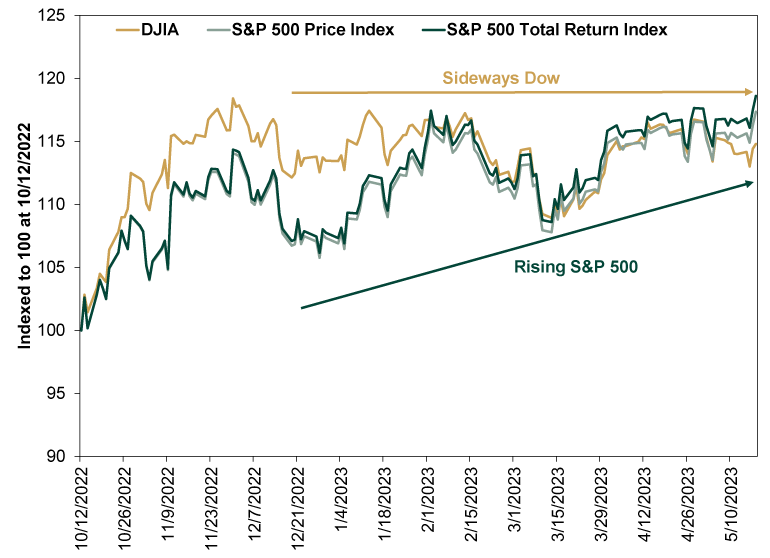
Source: FactSet, as of 5/19/2023. Dow Jones Industrial Average, S&P 500 Price Index and S&P 500 Total Return Index, 10/12/2022 – 5/18/2023. Indexed to 100 at 10/12/2022.
For investors who check their portfolios regularly, this split probably created some confusion. An investment portfolio’s returns are weighted by holding size—comparable to the S&P 500’s market cap weighting. Last autumn, we suspect investors with broad, diversified portfolios were a tad flummoxed that their accounts didn’t show quite as big a bounce as the Dow figures splashed across headlines. The risk here is that a Dow focus leads folks to upend a diverse portfolio for the sake of catching up to a broken index. As the chart shows, that wouldn’t have been necessary, as diversified indexes quickly caught up (and passed) the Dow.
There are also implications for more hands-off folks, which leads to the impact on sentiment generally. With Dow-oriented discussion dominating, simply reading the headlines gives the impression stocks aren’t doing anything. That there hasn’t been any material bounce for those who patiently endured a bear market. That probably contributes to the dogged persistence of recession forecasts, not to mention the heaps of attention on gold as it continues flirting with all-time highs. This, too, can lead to investment errors, which was the Journal article’s main point.[iv] But also, it has the benefit of keeping expectations low and building a nice wall of worry for a young bull market to climb.
Understand, we aren’t saying a weak Dow predicts a strong S&P 500. Stocks don’t predict stocks, and one index doesn’t predict another. Rather, we are theorizing that because a broken and underperforming index dominates the mainstream financial conversation, it helps tamp down sentiment, helping widen the already-yawning gap between expectations and reality. That gap is what propels stocks, and it looks quite wide to us.
[i] Source: FactSet, as of 5/19/2023. S&P 500 total returns, 12/31/2022 – 5/18/2023 and 10/12/2022 – 5/18/2023.
[ii] Ibid. MSCI World Index returns with net dividends, 12/31/2022 – 5/18/2023 and 10/12/2022 – 5/18/2023.
[iii] Ibid. Dow Jones Industrial Average price return, 12/31/2022 – 5/18/2023.
[iv] “Why You Keep Chasing the Wrong Stock Market,” Jason Zweig, The Wall Street Journal, 5/19/2023.
If you would like to contact the editors responsible for this article, please message MarketMinder directly.
*The content contained in this article represents only the opinions and viewpoints of the Fisher Investments editorial staff.
Get a weekly roundup of our market insights
Sign up for our weekly e-mail newsletter.

You Imagine Your Future. We Help You Get There.
Are you ready to start your journey to a better financial future?

Where Might the Market Go Next?
Confidently tackle the market’s ups and downs with independent research and analysis that tells you where we think stocks are headed—and why.
Related Resources
-
Market Analysis Business Friendly Bureaucracy or No, Britain is Growing2026-07-16
-
Economics Don’t Doubt the Old World2026-07-16
-
Market Analysis On the June Inflation Cooldown2026-07-14
-
Expert Commentary 3 Things You Need to Know This Week | US Inflation, China GDP, US Retail Sales
 2026-07-13


Learn More
Learn why 210,000 clients trust us to manage their money and how Fisher Investments and its affiliates may be able to help you achieve your financial goals.
As of 6/30/2026
New to Fisher? Call Us.
Contact Us Today