Personal Wealth Management / Market Analysis
The Tariff Tango’s Latest Moves
More tariffs are now a reality, but we think they are still too small to weigh on stocks for long.

Editors’ Note: MarketMinder favors neither party nor any politician. Our discussion of politics herein is limited to assessing the potential market impact of policy change.
Eight days ago, US President Donald Trump took to Twitter to tell the world trade talks with China weren’t moving fast enough, leading him to threaten to jack up tariffs on $200 billion in Chinese imports to 25%. He followed through on this threat Friday. Predictably, China responded with tariffs of its own Monday morning, as Chinese officials announced they would jack tariffs up on a range of about 5,000 US goods worth $60 billion from 5% ̶ 10% to 25%. Many now fear the tit-for-tat will continue, with Trump targeting the remaining $325 billion in Chinese imports. Already, the US Trade Representative’s Office has filed preliminary paperwork to that effect. Pundits are apoplectic—and markets are rocky, with US stocks dropping about 2% in early trading Monday. But in our view, this reaction is too hasty. We think now is a time to stay above the fray and remain calm. In our view, these new tariffs—even including threats— likely lack the necessary scale to derail the bull. While recent swings haven’t been fun, they aren’t atypical for markets—even in terrific years.
Exhibit 1 details the tariffs, showing the amount of goods targeted, the old and new tariff rates, and the resulting impact. In the last week, tariffs have increased by a total of $42 billion. (That is the sum of Friday’s US increase and Monday’s Chinese response.) If—and this is just an “if” at this point—the US enacts 25% tariffs on the remaining untaxed $325 billion in imports, tariffs would rise $81 billion more. Presumably, China would respond to this as well, although they haven’t given any specifics about what this may entail. We can’t scale that response as a result.
Exhibit 1: The Table of Tit-for-Tat Tariffs
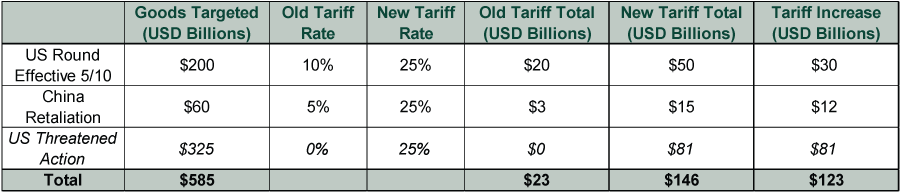
Source: Office of US Trade Representative, The Wall Street Journal, as of 5/13/2019. Italics indicate tariffs are under consideration but are not in place. China’s old tariff rate ranged from 5% to 10%; we use 5% here to intentionally overstate the increase the new, higher rates bring.
Those numbers may seem big, and yes, we think tariffs—always and everywhere—are economically bad. But scaling matters. Combined US and Chinese nominal GDP was $34.1 trillion at 2018’s end.[i] Tariffs now total $65 billion, or 0.19% of combined GDP. The actual change in the last week is even smaller—$42 billion, or 0.12%. Even if Trump enacts tariffs on the remaining $325 billion, the total would amount to 0.43% of GDP. Not huge. And these estimates assume that tariffs 1) are paid in full and 2) remain in place. We are skeptical of the former, and the latter seems contingent on trade talks.
Hence, stocks’ volatility in response to the tariff increase looks much more sentiment-driven than fundamental—likely to prove fleeting, in our view. This does little to change our expectation 2019 will prove a great year for stocks globally. Wobbles come with the territory in stocks and, unfortunately, such moves are the price tag for their historically high returns. As we type, the S&P 500 is down -4.6% from its record high.[ii] It could decline further. But either way, we think it is worth noting this isn’t an unusual move, even in great years. The S&P 500’s five best years since World War II are 1954, 1958, 1975, 1995 and 1997.[iii] All but 1995 had a decline similarly large or larger. 1975 featured a correction (a short, sharp, sentiment-driven drop exceeding -10%).[iv] 1997 had several bouncy periods, one rounding to a correction (-9.6% at its trough) and one reaching correction territory.[v]
In our view, now is a time to remain calm. In the end, we expect cooler heads—and the bull market—to prevail, whether these tariffs remain in place or not. Overthinking every move in the tariff tango the US and China are dancing seems unnecessary to us.
[i] Source: US Bureau of Economic Analysis and FactSet, as of 5/6/2019. Nominal US and China 2018 GDP in US dollars.
[ii] Source: FactSet, as of 5/13/2019. S&P 500 price return, 4/30/2019 – 5/13/2019 at 9:08AM PDT.
[iii] Source: FactSet and Global Financial Data, Inc. S&P 500 annual total return, 1946 – 2018.
[iv] Source: FactSet, as of 5/13/2019. S&P 500 price index return, 7/15/1975 – 9/16/1975.
[v] Ibid. S&P 500 price index return, 1/22/1997 – 4/11/1997 and 10/7/1997 – 10/27/1997.
If you would like to contact the editors responsible for this article, please message MarketMinder directly.
*The content contained in this article represents only the opinions and viewpoints of the Fisher Investments editorial staff.
Get a weekly roundup of our market insights
Sign up for our weekly e-mail newsletter.

You Imagine Your Future. We Help You Get There.
Are you ready to start your journey to a better financial future?

Where Might the Market Go Next?
Confidently tackle the market’s ups and downs with independent research and analysis that tells you where we think stocks are headed—and why.
Related Resources
-
Economics Don’t Doubt the Old World2026-07-16
-
Market Analysis Business Friendly Bureaucracy or No, Britain is Growing2026-07-16
-
Market Analysis On the June Inflation Cooldown2026-07-14
-
Expert Commentary 3 Things You Need to Know This Week | US Inflation, China GDP, US Retail Sales
 2026-07-13


Learn More
Learn why 210,000 clients trust us to manage their money and how Fisher Investments and its affiliates may be able to help you achieve your financial goals.
As of 6/30/2026
New to Fisher? Call Us.
Contact Us Today