Personal Wealth Management / Market Analysis
The Timely, Transatlantic Lesson From Cooling US CPI
Slowing US inflation puts fast UK wage growth in context.

Despite all the media racket over the S&P 500 breaching 20% up from the October 12 mark last week, there is no surefire way to know a bull market is underway early in its life.[i] But, with that said, here is a pretty good sign: When people move on from a big fear that accompanied the prior bear market … but move on to another, similar issue that seems like the next shoe to drop. So it went Tuesday with inflation. The US Labor Department’s May Consumer Price Index (CPI) report showed headline inflation slowing bigtime, from 4.9% y/y to 4.0%, while “core” CPI, which excludes food and energy, eased from 5.5% to 5.3%.[ii] Headlines acknowledge the improvement, but many publications buried the news under an allegedly alarming story about UK wage growth jumping 7.2% y/y in the three months through April, sending long-term UK gilt yields above their autumn 2022 highs—implying stubbornly high inflation will prompt the Bank of England (BoE) to keep ratcheting up rates.[iii] It all kind of reminds us of 2010, when mortgage-backed security fears morphed to municipal debt worries, which never materialized. Now US inflation concerns seem to have largely ceded the spotlight to UK inflation. But the US’s recent experience also shows why the UK edition doesn’t add up, likely rendering this another brick in what we increasingly think is a young bull market’s wall of worry.
Since peaking at 9.1% y/y in June 2022, US headline CPI has more than halved.[iv] A lot of this has to do with energy costs’ substantial easing, but the core inflation rate has also improved notably—from 6.6% y/y last September to 5.3%.[v] When you also exclude shelter—which we think is logical, considering the majority of that component is the imaginary owner’s equivalent rent line item (aka the amount homeowners would pay to rent their own house)—we get all the way down from 6.7% y/y last September to 3.4% in June.[vi] That is darned near the long-term average inflation rate and a sign inflationary forces have moderated substantially outside categories with big commodity exposure and supply quirks. And it is very, very good news. Not that inflation is a market driver, but this was a big source of fear for investors and folks just trying to make ends meet. Relief is a good thing.
And it should be encouraging for those now sweating UK inflation: All of this improvement happened despite above-average wage growth. When we study this, we like using the Atlanta Fed’s wage growth tracker, which follows individual workers’ earning power rather than statistical aggregates. It is newer and has a shorter history than the BLS’s official measure, but it isn’t skewed by high-earning folks retiring while young people enter the workforce—which can have a massive, illusory downward drag on broad national pay data. As you will see, this measure of wage growth has topped the year-over-year core inflation rate since last October. Yet inflation has still slowed. Broaden your view to the full history, which starts in March 1997, and you will see wage growth regularly moves after inflation, peaking and troughing at a lag.
Exhibit 1: Wage Growth Follows Inflation
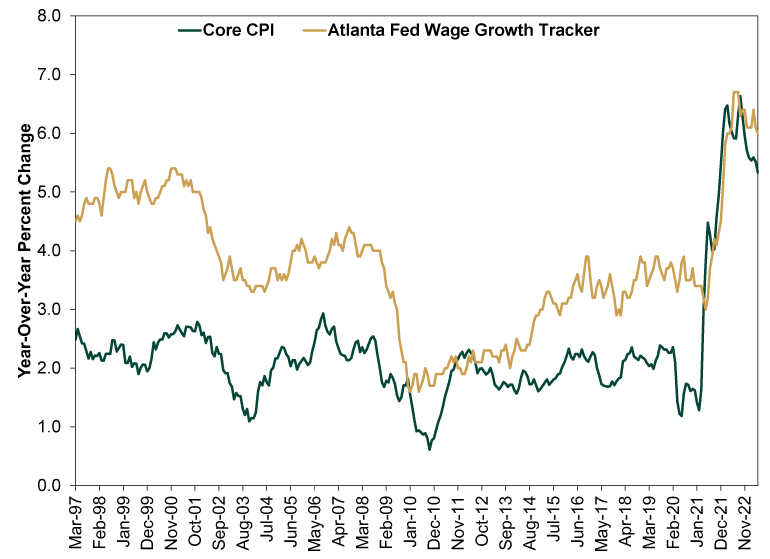
Source: St. Louis Federal Reserve and FactSet, as of 6/13/2023. Overall year-over-year wage growth and year-over-year core inflation rate, March 1997 – May 2023.
We don’t think this is surprising. In the late 1960s, Nobel Laureate Milton Friedman gave a rather forceful speech excoriating economists and central bankers for presuming rising wages drive inflation. He argued this couldn’t be true because employers factor in living costs when setting wages—making wages the last price to respond to inflationary forces. Therefore, anyone saying wages drive prices would be making a circular argument—Bad Logic 101. The next several decades’ worth of data proved him right, but myths die hard.
Which is why that UK wage growth rang such alarm bells. UK inflation has been more stubborn than its American cousin, owing largely to the way the government handled spiking energy prices. In the US, the relatively free pricing system made both the initial spike and comparably fast subsequent relief show up in fuel and household energy bills swiftly. But the UK capped energy prices, setting a minimum average annual rate that reset every six months. As is typical, the cap became a target for most suppliers, leading to huge semiannual stairstep increases. These didn’t go down well with the public, so the government added a second emergency price ceiling, which capped annual household costs while the government paid the difference between its ceiling and the regulatory cap. If you are confused, we don’t blame you. But the long and short of it is that even as wholesale energy costs plunged, it hasn’t yet shown up in household costs. The regulatory cap is only now coming down to the government’s emergency ceiling. Meanwhile, economists and even the BoE have zeroed in on stubborn food prices and wage growth as the UK’s inflation culprits, making that February – April pay acceleration such a big source of fear.
Here is another way to look at it: Wages have lagged UK inflation badly. Their 7.2% year-over-year growth rate may seem fast, but it pales next to the peak inflation rate of 9.6% y/y last October.[vii] Just like US wages, British pay has moved after inflation. But there, taxes have eaten a large share of this increase, as the government froze the income thresholds where the 20%, 40% and 45% tax rates kick in. In the US, tax bands are indexed to inflation, which gave households a modicum of relief this year. But the UK has frozen them through 2026 in the name of shrinking the deficit. Several key credits and allowances have also been frozen, leading to this awful quirk where incomes between £100,000 and about £125,000 face an effective 60% tax rate. So for those whose wage growth increased the amount of earnings taxed at 60%, the raise is much less than meets the eye. It is a modest, partial catch-up on the heels of nearly 10% inflation, not some massive new buying power.
As food price spikes fade and falling energy costs finally filter through to UK CPI, the wage chatter should quiet down. Plodding consumer spending (up just 0.2% annualized in Q1) will probably help, too.[viii] As for UK long rates, today isn’t the first time they have suddenly freaked out, and it probably won’t be the last. Bond markets can swing on sentiment every now and then, just like stocks. But over more meaningful stretches, markets weigh fundamentals, and we see plenty of UK disinflation for them to weigh looking forward—just as we have seen in the US.
If you would like to contact the editors responsible for this article, please message MarketMinder directly.
*The content contained in this article represents only the opinions and viewpoints of the Fisher Investments editorial staff.
Get a weekly roundup of our market insights
Sign up for our weekly e-mail newsletter.

You Imagine Your Future. We Help You Get There.
Are you ready to start your journey to a better financial future?

Where Might the Market Go Next?
Confidently tackle the market’s ups and downs with independent research and analysis that tells you where we think stocks are headed—and why.
Related Resources
-
Market Analysis Pumping Up the Yen?2026-07-17
-
Market Analysis Business Friendly Bureaucracy or No, Britain is Growing2026-07-16
-
Economics Don’t Doubt the Old World2026-07-16
-
Market Analysis On the June Inflation Cooldown2026-07-14


Learn More
Learn why 210,000 clients trust us to manage their money and how Fisher Investments and its affiliates may be able to help you achieve your financial goals.
As of 6/30/2026
New to Fisher? Call Us.
Contact Us Today