Personal Wealth Management / Market Analysis
The Trouble With Transport Indicators
Why gauges measuring the movement of stuff aren’t reliable market predictors.

Various freight and transport indicators have some worried the stock market’s current rally is built on sand. The Baltic Dry Index, a gauge of shipping costs, is tanking. The Dow Jones Transportation Average (DJTA) is lagging the Dow Jones Industrials (DJIA), allegedly failing to confirm the latter’s recent uptrend. Meanwhile, measures of freight shipping—like railcar loadings—are weak. Because of their focus on moving goods from point to point, some investors see these as real-time snapshots of demand, implying their tumble (or lackluster performance) is a sign of lurking economic weakness broader stock markets haven’t yet priced. But in our view, some gaping holes in this theory render these indicators less than telling.
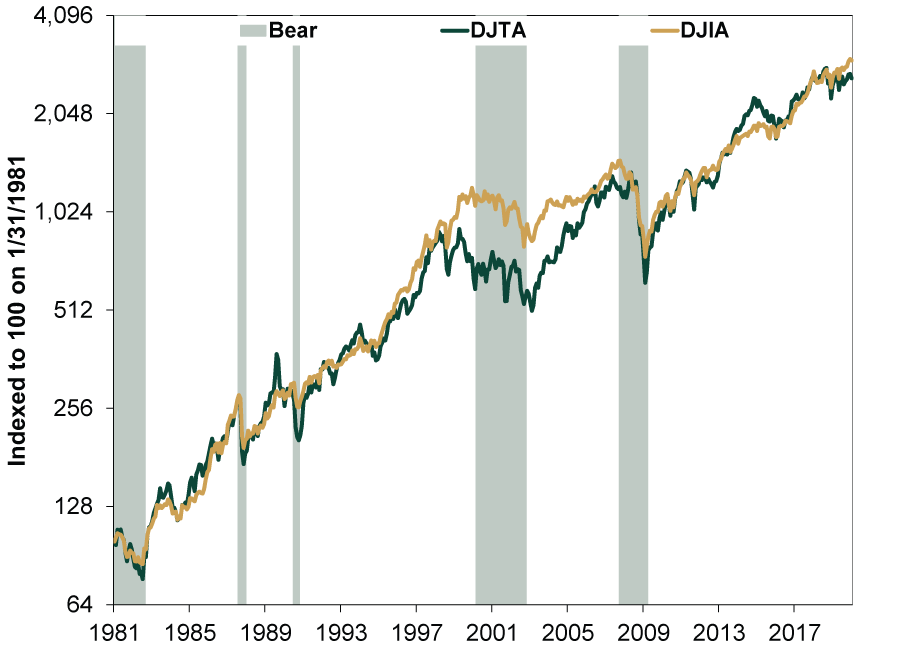
To start with the best-known measure, a more than century-old notion called Dow Theory posits the DJTA and DJIA need to move in the same direction to confirm a trend. If they hit highs together, that is supposedly bullish. If they hit lows together, bearish. If they deviate, the previous trend likely wouldn’t last. Today, the DJIA is hovering near new records—but the DJTA is lagging.
As Exhibit 1 shows, Dow Theory “worked” ahead of bears in 2000 – 2001 and 2008 – 2009—when the DJIA made new highs, the DJTA didn’t—and it could have helped you avoid 1990’s brief bear. But it wasn’t too helpful ahead of 1987’s Black Monday. It also gave false signals through the 1990s’ bull. In the 2010s, too, it flashed during 2012’s mid-cycle slowdown and 2015 – 2016’s manufacturing soft patch. Yet bear markets didn’t ensue. The problem with these types of gauges is sometimes they work—which is how they make names for themselves—but just as often they don’t, and you can’t know when they will or won’t beforehand.
Exhibit 1: Dow Jones Transports Diverging With Industrials’ Record Is Spotty
Source: FactSet, as of 2/6/2020. Dow Jones Transportation Average and Dow Jones Industrial Average, January 1981 – January 2020.
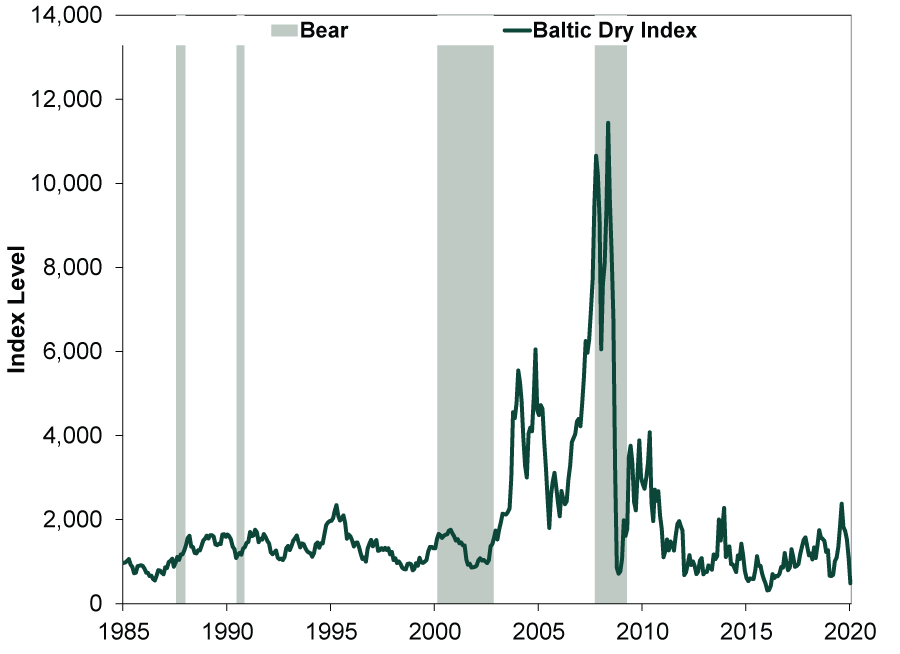
But today, it isn’t only Dow Theory that is drawing attention. The Baltic Dry Index (BDI), which tracks the average cost of shipping dry bulk goods globally, is now sitting near a four-year low. (Exhibit 2) But read that last phrase again—“four-year low.” That puts us at 2016, a year global stocks rose 7.5%.[i] Global GDP grew 3.5%.[ii] 2017 was better on both fronts, meaning the BDI’s low didn’t tell you anything about the economic or market future. It also rose initially in the last two bear markets before succumbing when oil and commodity costs tanked well into 2008’s recession. Again, not exactly a very helpful prediction tool.
Rather than indicating anything useful about the broad economy, the BDI merely reflects the supply and demand for seaborne freighters. If demand is high, that could boost it. But the gauge also reflects container ship supply and input costs to run them. If shipbuilders built a vast number of containerships, it could cause a glut, weighing on the gauge—even if demand is steady.
Exhibit 2: The Baltic Dry Index Seems Prone to Boom and Bust, but Unrelated to Stocks
FactSet, as of 2/6/2020. Baltic Dry Index, January 1985 – January 2020.
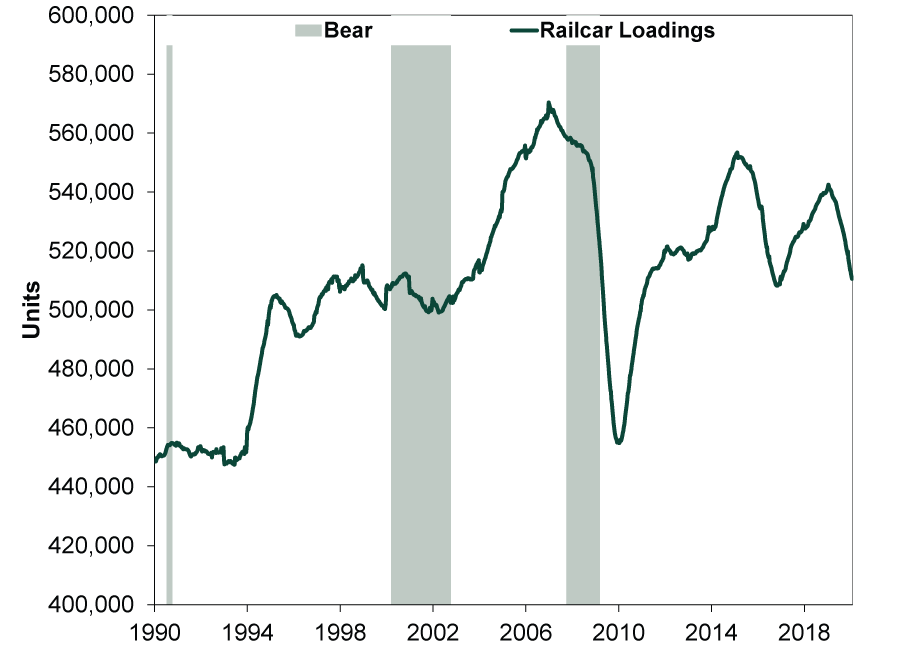
Railcar loadings have fallen over the last year, as they did before the 2000 – 2002 bear and 2008 – 2009’s global financial crisis. (Exhibit 3) But before getting concerned, consider the full history. Railcar loading declines in the mid-1990s and mid-2010s didn’t result in bears. In this cycle, demand for thermal coal is down dramatically. Coal has historically been a primary source of railcar demand. This cycle’s dips, in our view, say more about shifts in the energy industry than where markets are headed.
Exhibit 3: Railcar Loading Slumps Predicted Five of the Last Two Bears
Source: FactSet, as of 2/6/2020. Transport of Major US Railroads, carload plus intermodal, 52-week moving average, weekly, 1/5/1990 – 1/31/2020.
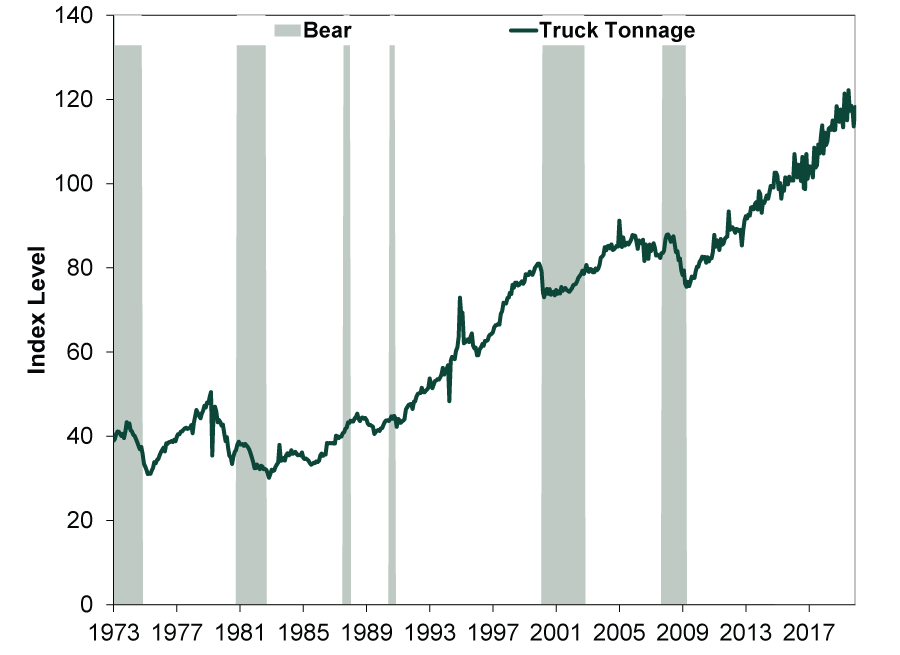
But while rail shipping is down and prices for freighters are weak, truck tonnage is near an all-time high—perhaps reflecting e-commerce’s rise. Regardless, as Exhibit 4 shows, it is at best a coincident indicator.
Exhibit 4: Truck Tonnage Dips Are at Best Coincident With Market Declines
Source: FactSet, as of 2/6/2020. American Trucking Association Truck Tonnage Index, January 1973 – December 2019.
Overall, the theory these gauges foretell the economy and stocks suffers from a basic flaw: They conflate the movement of “stuff” with the American economy. Maybe that seems sensible, as physical goods are tangible, unlike most market and economic data. But nowadays, the economy is no longer mainly about making—and moving—physical objects. The production of services, which need no shipping, has dominated the last several decades. Markets reflect that. Ditto for data and information, which flow over networks—no truck, train, plane or ship needed. Consider: 69% of personal consumption is services, not goods. Machinery and equipment are just 43% of business investment, with intellectual property products and structures comprising the balance.
Another fundamental reason they don’t work: Physical gauges are backward looking. They reflect what happened, which is irrelevant for forward-looking stocks. As for Dow Theory, transportation stocks don’t confer any real insight into the market as a whole. They are stocks, and stocks don’t predict stocks, which price in all widely known information simultaneously, in our view.
We aren’t dismissing these indicators in full. You may, at times, be able to glean useful information about the “stuff” side of the economy from them. But that is a limited view. To get the whole picture, we think you must also assess measures of lending and credit, money supply growth and services purchasing managers’ indexes. They provide a better indication of—and outlook on—overall economic activity.
If you would like to contact the editors responsible for this article, please message MarketMinder directly.
*The content contained in this article represents only the opinions and viewpoints of the Fisher Investments editorial staff.
Get a weekly roundup of our market insights
Sign up for our weekly e-mail newsletter.

You Imagine Your Future. We Help You Get There.
Are you ready to start your journey to a better financial future?

Where Might the Market Go Next?
Confidently tackle the market’s ups and downs with independent research and analysis that tells you where we think stocks are headed—and why.
Related Resources
-
Market Analysis The Politics and Practicalities of the Social Security Trust Fund2026-06-16
-
Market Analysis Gold Fails the Safe Haven Test Again2026-06-16
-
Market Analysis A Market Perspective on Iran Truce Whisperings2026-06-15
-
Weekly Wrap-Up Fisher Investments Reviews: Last Week in Markets—June 8 - June 122026-06-15


Learn More
Learn why 200,000 clients trust us to manage their money and how Fisher Investments and its affiliates may be able to help you achieve your financial goals.
As of 3/31/2026
New to Fisher? Call Us.
Contact Us Today