Personal Wealth Management / Economics
What Seasonal Adjustments Do and Don’t Tell Us
What investors can take away from the Department of Labor’s recent seasonal adjustment update.

Last Thursday, the US Department of Labor (DoL) announced seasonally adjusted initial jobless claims fell by 130,000 to 881,000 in the week ending August 29—dipping below the previous week’s level of around one million.[i] As much of the coverage noted, this decline in initial claims wasn’t the only story. You see, the drop in part reflected a change in how the DoL calculates seasonal adjustments—part of their effort to eliminate lockdown-driven reporting issues. To us, this is a timely reminder that interpreting economic data well requires understanding esoteric nuances like seasonal adjustments.
Many economic data series fluctuate depending on the time of the year. For example, US retail sales tend to be higher in November and December due to holiday shopping. Similarly, the utilities subcomponent of US industrial production is usually up during the winter months due to increased heating demand. Reporting agencies try to account for this expected skew by applying seasonal adjustments, thereby facilitating month-to-month comparison and clarifying trends. Exhibit 1 illustrates this, showing the enormous seasonal volatility in a non-adjusted series versus the clarified seasonally adjusted view.
Exhibit 1: US Retail Sales, Seasonally Adjusted vs. Not Seasonally Adjusted
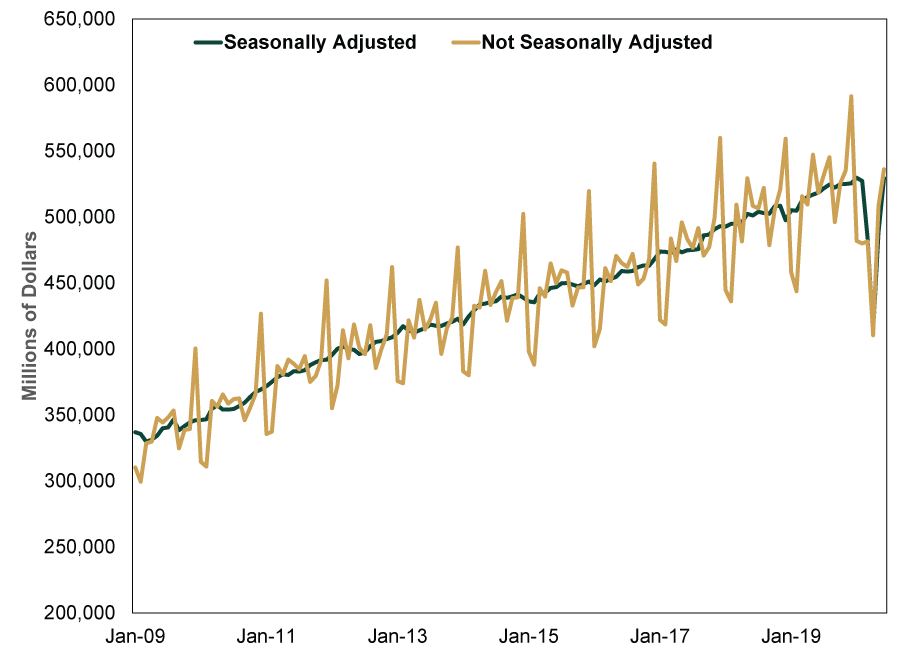
Source: US Census Bureau, as of 9/9/2020. Monthly US retail sales, seasonally adjusted and not seasonally adjusted, January 2009 – July 2020.
The DoL seasonally adjusts its weekly unemployment insurance claims report, too, due to the seasonal nature of some lines of work (e.g., auto plant workers, some construction workers and school employees). However, this year’s COVID-driven economic shutdown caused unprecedented distortions across the economy. After shelter-in-place orders started going into effect in mid-March, initial jobless claims skyrocketed, soaring to 3.3 million in the week ending March 21 after the prior week’s 282,000.[ii] Though most states began easing restrictions by May, reopening progress has been slow and staggered. Unsurprisingly, these unprecedented disruptions wrecked some of the assumptions underlying the BLS’s seasonal adjustments. For example, auto factories’ typical summertime closures for maintenance and retooling usually lead to an uptick in jobless claims—but those plant closures didn’t occur as scheduled this year, as automakers sought to make up for lost time and production tied to springtime closures.
At August’s end, the DoL announced a change to its seasonal adjustment methodology, from multiplicative to additive. In plain English, a multiplicative method means raw data series is divided by an index that tries to take historical seasonal swings into account. When a data series experiences a sudden, large change—e.g., what happened this year—the multiplicative approach can meaningfully overstate the seasonal effect. In contrast, with the additive method, the seasonal effect is an independent number added to or subtracted from the original data point. The DoL thinks this methodology will more accurately reflect seasonal effects in this unprecedented economic environment.
The methodology change applies to the data series starting with last week’s report—prior weeks won’t be revised. In our view, this is worth keeping in mind, as the jobless claims data series may start showing a notable divergence due to the calculation change. Some private research outfits have estimated that if the DoL applied its new methodology when the pandemic began, the cumulative number of seasonally adjusted jobless claims could be about four million lower since mid-March.[iii] Whether that specific number is correct or not, it doesn’t negate the major labor market damage. Rather, it just provides a sense of how much the prior methodology could have overstated the numbers over the past several months.
For investors, we think the DoL’s methodology update offers an important reminder: As comprehensive as economic data series strive to be, they will always have some limitations. For example, the smart people at the Bureau of Economic Analysis have made a concerted effort to uncover why Q1 GDP growth has been consistently weaker relative to the other quarters for years—even after seasonal adjustment—and it remains unclear whether they have fully addressed it.
These agencies seek to provide more accurate information about what is happening in the economy, but “more accurate” is unlikely to ever be perfect. Grasping the nuances of data tabulation can help reveal potential hidden negatives and positives—or at least help investors understand some caveats to the headline number. But keep in mind that these updates also don’t change much for the ultimate leading indicators: stocks, which have long moved on from the conditions recent economic data reflect.
[i] Source: Department of Labor, as of 9/4/2020.
[ii] Source: Federal Reserve Bank of St. Louis, as of 9/8/2020.
[iii] “Jobless Claims Ease, Showing Slowly Improving Labor Market,” Eric Morath, The Wall Street Journal, September 3, 2020.
If you would like to contact the editors responsible for this article, please message MarketMinder directly.
*The content contained in this article represents only the opinions and viewpoints of the Fisher Investments editorial staff.
Get a weekly roundup of our market insights
Sign up for our weekly e-mail newsletter.

You Imagine Your Future. We Help You Get There.
Are you ready to start your journey to a better financial future?

Where Might the Market Go Next?
Confidently tackle the market’s ups and downs with independent research and analysis that tells you where we think stocks are headed—and why.
Related Resources
-
Market Analysis On the Iran Flare Up2026-07-08
-
Expert Commentary 3 Things You Need to Know This Week | Midterm Miracle, US Jobs, Tax Planning
 2026-07-07
 -
Weekly Wrap-Up Fisher Investments Reviews: Last Week in Markets—June 29 - July 32026-07-07
-
Market Analysis Can Germany Engineer Faster Growth at Last?2026-07-07


Learn More
Learn why 210,000 clients trust us to manage their money and how Fisher Investments and its affiliates may be able to help you achieve your financial goals.
As of 6/30/2026
New to Fisher? Call Us.
Contact Us Today