Personal Wealth Management / Market Analysis
Adventures in Forecasting: CBO Edition
Whether you think they're too sunny or sour, the Congressional Budget Office's latest debt forecasts probably won't match reality.

The Congressional Budget Office (CBO) completed its semi-annual assignment Wednesday, releasing its updated 10-year budget projection for 2014. Some things look better than February's forecast, some things worse, and media reactions were overall mixed. Our take? If you're looking for a market forecasting tool, this isn't one (super long-term forecasts never are).
The headlines focused on the big numbers. CBO raised its Fiscal Year 2014 deficit projection by $14 billion from February's, saying it overestimated the rise in corporate tax revenue and economic growth-in other words, they had to account for Q1's weather-related pullback. But they expect growth to bounce a bit higher from 2014 to 2017 before leveling off at 2.2% in 2018, boosting their long-term revenue estimates. Between that and a slower expected rise in interest payments, they now think 2024's deficit will be $114 billion lower than first forecast (hooray?)-good enough to drop 2024's projected debt-to-GDP ratio from 79.2% to 77.2%. Still benign by historical standards, and only 5 percentage points above today.
But there is little chance any of that comes true, judging by the past decade's worth of CBO forecasts-they're near-comically off base (and their sub-forecasts for GDP, interest rates and so many more are equally off). In 2003, the CBO thought we'd have a $508 billion surplus in 2013 and a 14.4% debt-to-GDP ratio. Reality? A $680 billion deficit and debt-to-GDP of 71.5%. Few projections fare better, as shown in Exhibit 1.
Exhibit 1:Forecast and Actual Budget Surpluses or Deficits and Debt-to-GDP Ratios, 2004-2013
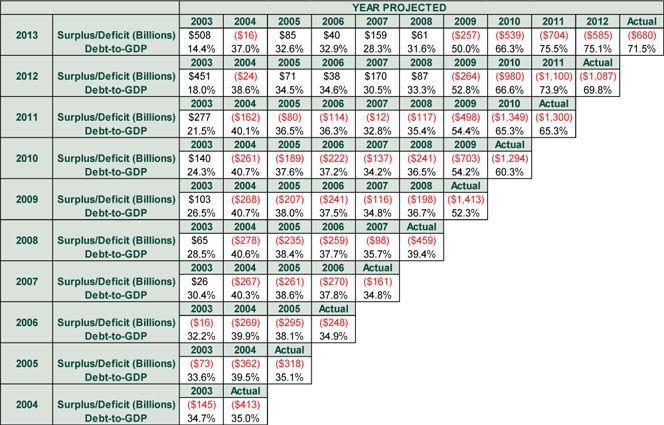
Source: St. Louis Federal Reserve and Congressional Budget Office, as of 08/28/2014. Projected values are taken from CBO Budget and Economic Outlook Reports released in February of each year.
Of course, the above doesn't speak to what really matters-debt servicing costs. Which the CBO estimates will be a 16.5% of tax revenue by 2024. High! More than double 2013's 8%! Why so high? Well, they assume 10-year Treasury yields rise to 4.7% by 2019 and stay there. To say that would be unusual is an understatement, as shown in Exhibit 2. Oh and in case you're curious, back in 2002, they thought 10-year yields would hover near 6% for the next decade. Nowhere close to true!
Exhibit 2: US 10-Year Treasury Yield, 2003-2024
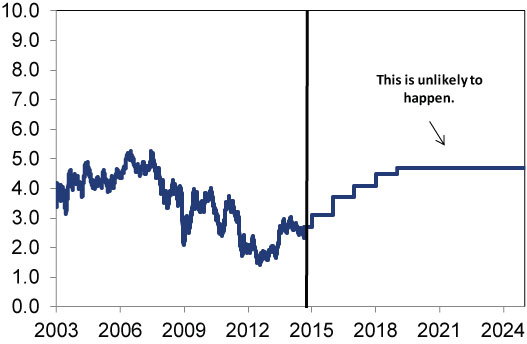
Source: St. Louis Federal Reserve and Congressional Budget Office, as of 08/28/2014. 12/31/2012-08/28/2014 show actual daily US 10-Year Treasury Yields (Constant Maturity); 08/29/2014-12/31/2024 show projected annual rates from the CBO's August 2014 Budget and Economic Outlook Report.
The CBO applies the same straight-line illogic to pretty much every variable you can think of. Exhibits 3 and 4 show actual and projected GDP and Personal Consumption Expenditures-just a taste. Their projections for unemployment, labor force participation, wages, corporate profits and short-term interest rates are similarly fairy-tale.
Exhibit 3: Annual Percent Change in Real GDP, 2003-2024
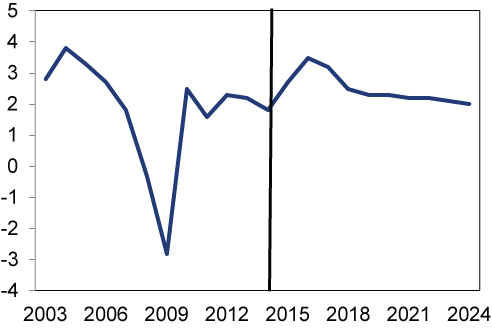
Source: St. Louis Federal Reserve and Congressional Budget Office, as of 08/28/2014. 2003-2013 show actual annual GDP growth in 2009 USD. 2014-2024 show projected Real GDP annual growth rates from the CBO's August 2014 Budget and Economic Outlook Report.
Exhibit 4: Annual Percent Change in Real Personal Consumption Expenditures, 2003-2024
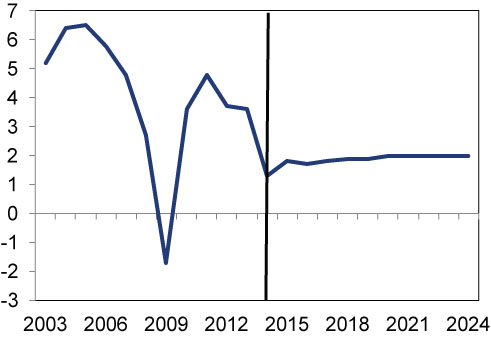
Source: St. Louis Federal Reserve and Congressional Budget Office, as of 08/28/2014. 2003-2013 show actual annual PCE growth in 2009 USD. 2014-2024 show projected Real PCE annual growth rates from the CBO's August 2014 Budget and Economic Outlook Report.
To be clear: The CBO might get it right this time-you never know! Or reality could be better. Heck, it could be worse. There is zero way to know today-forecasting that far is impossible. Too much can change between now and then. Like the tax code. Or cyclical factors. Or productivity-enhancing technology. But if things do go south, it won't happen overnight. Markets will have plenty of warning. So will Congress. Another variable!
For investors, what matters most is the next 12-18 months-that's where markets look. And with debt getting more affordable these days, the chance America goes Greek is slim to none.
If you would like to contact the editors responsible for this article, please message MarketMinder directly.
*The content contained in this article represents only the opinions and viewpoints of the Fisher Investments editorial staff.
Get a weekly roundup of our market insights
Sign up for our weekly e-mail newsletter.

You Imagine Your Future. We Help You Get There.
Are you ready to start your journey to a better financial future?

Where Might the Market Go Next?
Confidently tackle the market’s ups and downs with independent research and analysis that tells you where we think stocks are headed—and why.
Related Resources
-
Market Analysis The New Tariffs in Town Are Still Old News2026-07-24
-
Expert Commentary This Week in Review | Market Volatility, Tariffs, SpaceX
 2026-07-24
 -
Economics A Summertime Check-in on US Consumers2026-07-23
-
Expert Commentary Why Ken Fisher Is Optimistic About European Stocks
 2026-07-23


Learn More
Learn why 210,000 clients trust us to manage their money and how Fisher Investments and its affiliates may be able to help you achieve your financial goals.
As of 6/30/2026
New to Fisher? Call Us.
Contact Us Today