Personal Wealth Management / Economics
April’s Astounding Employment Report Confirms What We All Expected
The jobs data are awful, but they don’t change much for stocks.

Friday morning, the US Bureau of Labor Statistics’ much-watched Employment Situation Report confirmed what we all expected: an unprecedented spike in the unemployment rate. In April, the rate surged from March’s 4.4% to 14.7%, underpinned by a 19.52 million decline in private-sector payrolls.[i] State and local governments cut another 980,000 jobs, bringing the total drop in non-farm payrolls to an astounding 20.5 million.[ii] This—plus each week’s lofty-and-previously-unheard-of millions of new unemployment insurance claims—has many fretting weak consumer demand forestalling an economic recovery, dooming stocks to more downside ahead. While we can’t know if March 23 was this bear market’s low, we are quite confident employment issues won’t impede the next bull market—and economic recovery—from starting.
The massive hit business shutdowns have caused the labor market is unmistakable. To put its scope in some sort of perspective (to the extent that is possible), the BLS has published the unemployment rate in its current format monthly since 1948. Prior to April, the biggest single monthly increase in the unemployment rate was October 1949’s 1.3 percentage points.[iii] That rate rose by 10.3 percentage points in April. The biggest single monthly decline in private-sector payrolls? 1.766 million in September 1945, a clear effect of World War II ending. More than 10 times as many lost jobs in April. Those are all just statistics, but make no mistake: Joblessness is a personal tragedy. These highlight the macroeconomic scope of the issue, but they don’t speak to what individuals are going through. If you or a family member have been affected, you are in our thoughts.
Now, there are reasons to think looking at the headline unemployment rate (what the BLS’s statisticians call the U-3 rate) understates reality. As many likely recall from the last recession, the unemployment rate isn’t calculated by dividing the number of unemployed by the population. The numerator is the number of unemployed who sought work in the last four weeks divided by the labor force (the number who worked or sought work in the last four weeks). Laid-off workers who don’t seek a job because they don’t think they can find one (so-called discouraged workers) fall out of the calculation. To see them—and people working part-time for economic reasons—you must look to the U-6 rate, the broadest BLS measure of unemployment. The U-6 rate ticked up from 7.0% in February to 8.7% in March.[iv] Last month, it spiked to 22.8%.[v] This is of course the largest monthly increase to U-6’s highest level ever, dating to its 1994 inception.
Exhibit 1: Unemployment’s Unprecedented Spike—Headline and U-6 Rates
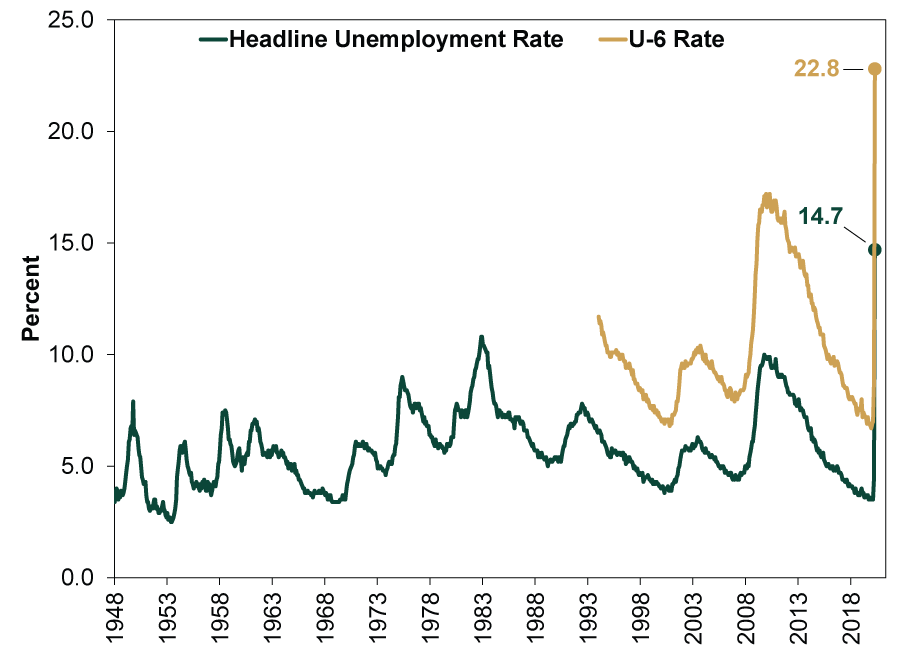
Source: US Bureau of Labor Statistics, as of 5/8/2020. Headline (U-3 Rate) from January 1948 – April 2020. U-6 Rate from January 1994 – April 2020.
Now, there are aspects of this report that highlight a key element of the current crisis. One: The massive spike in unemployment is underpinned by temporary, or furloughed, workers rather than permanent layoffs. Of roughly 20 million people people who reported they had been laid off in April, 18.06 million said the move was temporary.[vi] That highlights a key point we have made lately: The crisis’s duration matters much more than its depth. If businesses are able to materially resume soon, many of these furloughed workers could return rather swiftly. If not, layoffs may increasingly become permanent, causing more lasting dislocations. This is perhaps particularly true considering retailers and the leisure and hospitality industry (which would include restaurants) account for almost 8 million unemployed workers.
For investors, these data are no doubt interesting and help paint the picture of the COVID-19 response’s hit to business. But we don’t think they are useful in shaping your economic or market outlook. For one, the unemployment rate is a widely watched indicator even in normal, placid, bull market days. During downturns, it gets even more attention, perhaps because pundits and reporters know readers can easily relate to it.
Hence, the moment business shutdowns started in March, the effect on jobs was among the first things people talked about. Each Thursday’s jobless claims report has been a front-page mainstay and led off local evening news broadcasts. Is there an investor alive unaware of business disruptions’ hit to jobs? Investors generally don’t wait for data releases to confirm what we all know. They move in advance, rendering jobs data very unlikely to knock stocks for long. It is very short term, but perhaps this is the message markets have sent lately: We have had seven weekly initial jobless claims reports since the crisis first demonstrably hit jobs data on March 26 and one monthly Employment Situation Report prior to Friday’s. The S&P 500 rose on five of these 8 days, averaging 1.19% gains. US stocks are up again as we type.[vii] We aren’t saying big jobless numbers are bullish—they aren’t—just that markets are very well aware of them in advance.
But even beyond this, the principal reason high unemployment is unlikely to forestall a recovery: Jobs data follow growth. They don’t lead it. Consider the last expansion. As Exhibit 2 shows, the financial crisis-driven bear market ended on March 9, 2009. Economic growth returned that July. The headline unemployment rate rose through October 2009, with U-6 peaking that December.
Exhibit 2: Stocks Move First, Economy Second, Jobs Last

Source: FactSet, National Bureau of Economic Research and the US Bureau of Labor Statistics, as of 4/23/2020.
The same pattern repeats throughout US history. Why? Business owners are typically slow to make employment-related decisions. Employees are a big cost—and investment. Leaders will usually want to wait as long as possible before making material decisions on payrolls.
The upshot of this: Virtually every new bull market and economic recovery starts out as “jobless.” It is a common refrain among those who hype a disconnect between stocks and reality, with many citing it as a sign the rally is false. While we can’t know now if the rally since March 23 is real, we fully anticipate stocks will begin rising before jobs data look better. Counterintuitive as that may seem, it is totally normal.
[i] Source: US Bureau of Labor Statistics, as of 5/8/2020.
[ii] Ibid.
[iii] Ibid.
[iv] Ibid.
[v] Ibid.
[vi] Ibid.
[vii] Source: FactSet, as of 5/8/2020. S&P 500 Total Return Index frequency of positivity on dates of US employment data including weekly jobless claims and the monthly Employment Situation Report.
If you would like to contact the editors responsible for this article, please message MarketMinder directly.
*The content contained in this article represents only the opinions and viewpoints of the Fisher Investments editorial staff.
Get a weekly roundup of our market insights
Sign up for our weekly e-mail newsletter.

You Imagine Your Future. We Help You Get There.
Are you ready to start your journey to a better financial future?

Where Might the Market Go Next?
Confidently tackle the market’s ups and downs with independent research and analysis that tells you where we think stocks are headed—and why.
Related Resources
-
Expert Commentary This Week in Review | Q2 Market Recap, June US Jobs, Trade Deal Update
 2026-07-03
 -
Market Analysis Declaring Fed Independence Fears False2026-07-01
-
Market Analysis Why El Niño Doesn’t Necessitate Portfolio Shifts2026-07-01
-
Market Analysis Reader Mailbag: June 20262026-06-30


Learn More
Learn why 200,000 clients trust us to manage their money and how Fisher Investments and its affiliates may be able to help you achieve your financial goals.
As of 3/31/2026
New to Fisher? Call Us.
Contact Us Today