Personal Wealth Management / Economics
Digging Into March Retail Sales
A look under the hood at March retail sales data that pundits proclaimed a disappointment after factoring in inflation.

Have high gas prices started taking a toll? Retail sales rose 0.5% m/m in March, but excluding gas stations, they fell -0.3%, sparking stagflation concerns.[i] Stagflation, or high inflation amid stagnant growth, connotes 1970s-style economic malaise, but we don’t think those comparisons—or the alleged ramifications for markets—are apt. Retail sales are only a subset of consumer spending, but the glimpse they give still shows demand holding relatively firm in the face of higher prices.
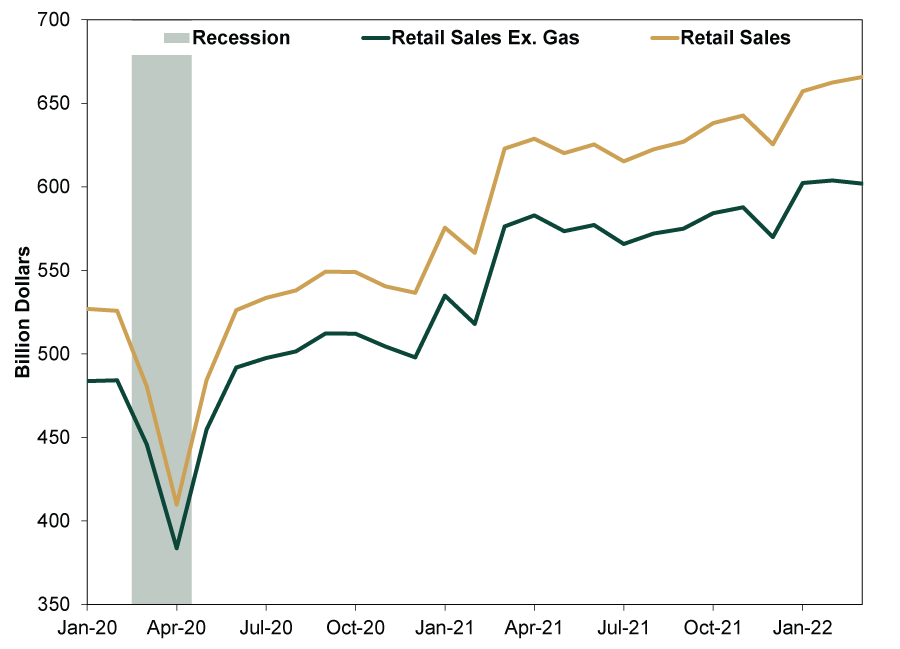
Exhibit 1 depicts the slight divergence between retail sales with and without gas spending. As pump prices hit a record-high national average of $4.33 in March, gas station sales soared 8.9% m/m, driving retail sales’ monthly gain.[ii] These figures aren’t adjusted for inflation, so it seems fair to say rising prices were responsible for much of the increase.
Exhibit 1: Retail Sales’ Latest Wiggles in Perspective
Source: Federal Reserve Bank of St. Louis, as of 4/14/2022.
Factor in March’s 1.2% m/m consumer price index (CPI) increase, which was largely energy driven, and pundits suggest real consumption is weaker under the surface than the headline figure implies.[iii] Maybe, but that presumes using CPI to deflate retail sales gives anything more than a rough picture of retail sales volumes—the amount of goods exchanged independent of their value. Problem is, the categories CPI covers, which skew heavily toward services, are far broader than what retail sales cover and the weights don’t match, so it is better to compare category by category.
The evidence here is mixed. Take food services, the only services category in the Commerce Department’s retail sales report, which rose 1.0% m/m in March.[iv] The roughly corresponding CPI category—food away from home—rose 0.3% m/m.[v] Spending here outpaced inflation. On the other hand, while grocery store sales rose 1.3% m/m, CPI’s food at home line item rose 1.5%.[vi] That is a rather granular look, which makes it hard to disentangle the overall effects—particularly when most services aren’t considered. The Bureau of Economic Analysis (BEA) will provide a much more comprehensive report on March consumer spending—personal consumption expenditures (PCE), which includes services spending and, unlike retail sales, adjusts for inflation—on April 29.[vii]
While last month’s retail sales ex. gas dip is noteworthy, we think markets look bigger picture. Retail sales represent less than half of PCE and less than a third of GDP.[viii] Not only are they not terribly representative, they are also backward looking. For forward-looking stocks, they don’t say anything about where the bulk of consumer spending is headed. High gas prices have obviously helped gas station sales—and may have detracted from other categories—but that isn’t a very earthshattering observation, much less one markets haven’t figured out already. That is one reason why economists like to strip out gas—and autos, building materials and food services to boot—for a view of so-called “core” retail sales. Those items tend to be volatile month to month and give little indication of sales’ longer-term direction. While core retail sales ticked -0.1% m/m lower in March, February’s results were revised higher, prompting some outlets to raise their Q1 GDP estimates.[ix] But even here, the series is widely watched, backward looking and not predictive.
Stocks care more about the economy’s overall trend over the next 3 – 30 months, which is why they are good at looking through short-term turbulence. For example, when retail sales dipped in spring and summer 2021 following late-2020 and early-2021’s initial reopening surge, the S&P 500 rose 11.1% through their April to July slide.[x] Now, with stocks in a correction (short, sharp, sentiment-driven -10% to -20% pullback) early this year, close inspection of incoming economic data for signs of weakness is par for the course amid market volatility—and surrounding fears over Chinese lockdowns and the potential for escalating geopolitical conflict. But we think slowing US growth stems to a noteworthy degree from a return to normal pre-pandemic patterns, which was always likely post-reopening. Retail sales’ following that script shouldn’t derail the bull market.
On that note, digging further under the hood, March retail sales had some encouraging nuggets. Online sales moderated, but this seems tied to the return to pre-pandemic habits. Meanwhile, 10 of 13 retail categories grew, including furniture; electronics; building and garden supplies; clothing; sporting goods and hobbies; appliances; and restaurants. Such broad contributions undercut the notion food and energy prices are prohibitive.
While auto sales fell, this was because of ongoing shortages—not because the demand isn’t there. Good Friday’s industrial production report showed motor vehicle production jumped 12.5% m/m in March, suggesting component bottlenecks are starting to ease, but the level remains -10.3% below pre-pandemic February 2020’s, and auto inventories are still near all-time lows. Wards Auto estimates February inventories were just 107,390, up slightly from September 2020’s record-low 105,780.[xi] Considering inventory levels usually average around 1.3 million, it is no wonder cars are scarce—and expensive. The BEA reports February’s auto inventory-to-sales ratio hit a record low 0.373.[xii] Normally, it is about 2.5.[xiii] Car demand is far from representative of overall household expenditures, but there is very little here to suggest consumers are faltering.
Meanwhile, other reports indicate services for travel and recreation are surging. The latest high-frequency data, which we hasten to add aren’t seasonally adjusted and provide only a narrow (backward-looking) scope into consumer behavior, show TSA checkpoint travel, hotel occupancy and movie ticket sales numbers are all close to getting back to pre-pandemic levels.[xiv] More broadly, filling out the economic puzzle, March’s Institute for Supply Management’s services purchasing managers’ index (PMI) rose 1.8 points to 58.3, signaling widening expansion as levels over 50 imply growth.[xv] Then, too, 17 of 18 services industries—representing the lion’s share of the US economy—reported expanding business activity, with only agriculture, forestry, fishing and hunting decreasing. Moreover, services PMI new orders rose 4.0 percentage points to 60.1; a good sign growth is set to continue in Q2.
In our view, such a big gap opening up between reality and expectations—as stagflation fears brew despite healthy underlying economic fundamentals—suggests the engine for this bull market to climb the wall of worry remains in gear.
[i] Source: US Department of Commerce, as of 4/14/2022.
[ii] “Higher Gasoline Prices Flatter U.S. Retail Sales; Consumers Remain Resilient” Lucia Mutikani, Reuters, 4/14/2022.
[iii] Source: Bureau of Labor Statistics, as of 4/12/2022.
[iv] See note i.
[v] See note iii.
[vi] See notes iv and v.
[vii] Albeit one day after the BEA releases Q1 GDP, which includes March PCE data.
[viii] Source: Federal Reserve Bank of St. Louis, as of 4/18/2022. January, February and March retail sales annualized as a percentage of Q1 PCE and GDP annualized.
[ix] See note ii.
[x] Source: FactSet, as of 4/20/2022. S&P 500 total return, 3/31/2021 – 7/31/2021.
[xi] Ibid. Wards Auto unit inventory level estimate, January 1967 – February 2022.
[xii] Source: Federal Reserve Bank of St. Louis, as of 4/20/2022. Auto inventory/sales ratio, January 1993 – February 2022.
[xiii] Ibid.
[xiv] “Four High Frequency Indicators for the Economy,” Bill McBride, Calculated Risk, 4/18/2022.
[xv] Source: ISM, as of 4/5/2022. Services PMI, March 2022.
If you would like to contact the editors responsible for this article, please message MarketMinder directly.
*The content contained in this article represents only the opinions and viewpoints of the Fisher Investments editorial staff.
Get a weekly roundup of our market insights
Sign up for our weekly e-mail newsletter.

You Imagine Your Future. We Help You Get There.
Are you ready to start your journey to a better financial future?

Where Might the Market Go Next?
Confidently tackle the market’s ups and downs with independent research and analysis that tells you where we think stocks are headed—and why.
Related Resources
-
Economics Quick Hit: Durably Broad-Based Growth2026-07-29
-
In The News Why Kevin Warsh should think twice about hiking interest rates — even as anxiety over the Iran war grows2026-07-27
-
Expert Commentary 3 Things You Need to Know This Week | Fed Meeting, US Q2 GDP, Eurozone Inflation
 2026-07-27
 -
Weekly Wrap-Up Fisher Investments Reviews: Last Week in Markets — July 20 - July 242026-07-27


Learn More
Learn why 210,000 clients trust us to manage their money and how Fisher Investments and its affiliates may be able to help you achieve your financial goals.
As of 6/30/2026
New to Fisher? Call Us.
Contact Us Today