Personal Wealth Management / Market Analysis
Hiking the (Still) Upward-Sloping Yield Curve
While the US yield curve has flattened of late, we don’t believe a recession looms.

To the surprise of many, long-term interest rates are flattish this year—despite the Fed raising short-term rates. The result: The US yield curve has flattened. Some in the media fret the potential negative impact on bank lending, economic growth and stocks, worrying this leading economic indicator is flashing yellow. But in our view, this is premature. Yield curves are certainly worth monitoring, but contrary to “flattest in a decade” worries, we don’t believe they signal an approaching recession today.
Yield curves are critical indicators of credit market health. They plot different yields for a single issuer’s bonds across all maturity dates, with the difference between any two points called a spread. In America, the Treasury yield curve is the most significant. Since the US government is generally considered to have very little (if any) default risk, all other debt is priced based on Treasury rates. The influence isn’t just on bonds: Banks’ business model relies on borrowing short term (think: depositors) and lending long (think: businesses and homeowners). Thus, a steeper yield curve means more profitable lending and vice versa. Banks respond to incentives, so when lending is profitable they tend to make more loans. An inverted yield curve—when short rates exceed long—suggests banks will struggle to lend profitably. This is a signal credit markets aren’t functioning well—potentially impacting economic growth.
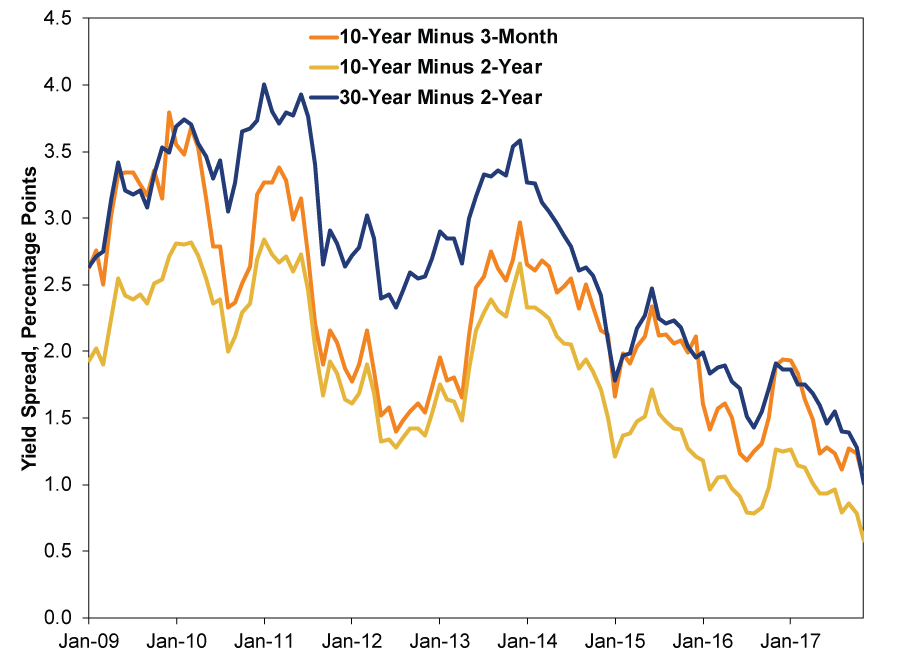
For that reason, yield curves are a very important leading economic indicator. It is no surprise, given this fundamental backdrop, that the US yield curve inverted before each of the last six US recessions. Today, while media cite a variety of different spreads in their discussions—the spread between 2-year and 30-year Treasury yields or 5-year and 10-year rates—none are inverted presently. Flatter than a year ago, maybe. But positive nonetheless.
Exhibit 1: Commonly Cited Yield Spreads
Source: Federal Reserve Bank of St. Louis, as of 11/27/2017. January 2009 – November 2017. Data are monthly, with 11/22/2017 (latest data available) cited for November 2017.
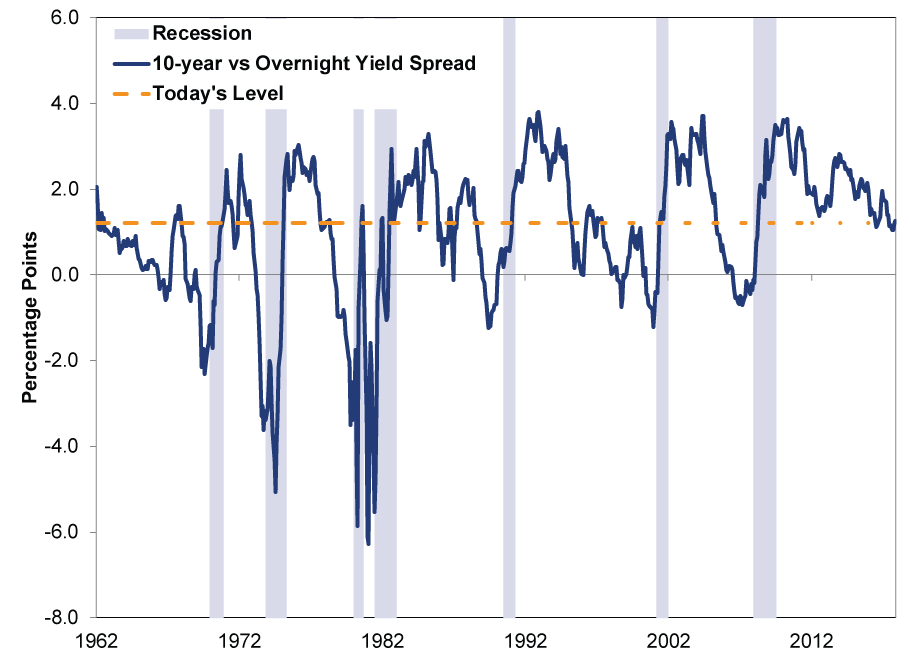
Now, to us, if you are using the yield spread to forecast broad economic conditions, it makes the most sense to base this on the spread between the effective fed-funds rate and the 10-year Treasury. Using longer maturities introduces potential skew. This is also the measure The Conference Board includes in its US Leading Economic Index. Today, the spread between 10-year rates and the effective fed-funds rate is 1.23 percentage points—not super wide by historical standards, but far from inverted.
Exhibit 2: Today’s Yield Spread in Context
Source: St. Louis Federal Reserve, as of 11/22/2017. Spread between 10-year Treasury constant maturity and Effective Federal Funds Rate, from January 1962 – November 2017.
A lot of the current fear hinges on the supposition that recent flattening is only a prelude to inversion. Which is possible! Obviously, all inverted yield curves flattened first. Yet not all flattening immediately precedes inversion. Look no further than 2012 for an example of that! Furthermore, in 1995 the yield curve briefly inverted—only to reverse and steepen some.
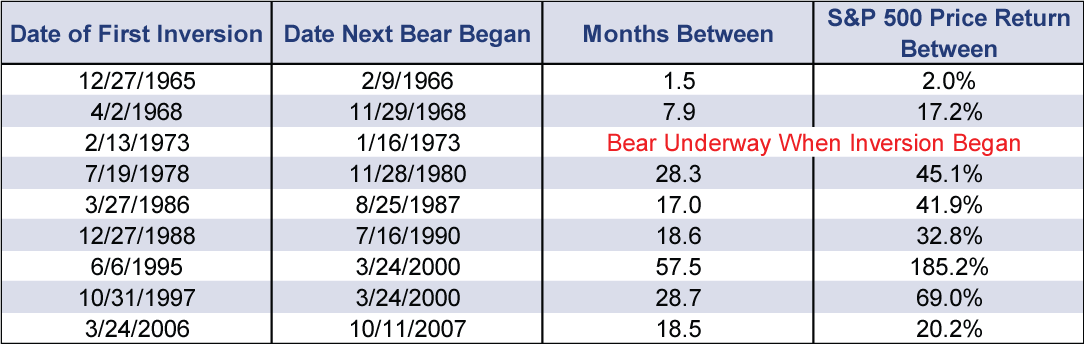
Besides, while yield curve inversion is a sign not all is well in the credit markets, it isn’t a precise timing tool. There is usually (although not always) a significant lag between inversion and a bear market beginning, as Exhibit 3 illustrates. History suggests selling the moment the yield curve inverts risks missing out on potentially significant stock market gains.
Exhibit 3: Yield Curve Inversion Isn’t a Reliable Timing Tool
Source: FactSet and the Federal Reserve Bank of St. Louis, as of 11/27/2017. S&P 500 price returns for the date ranges displayed.
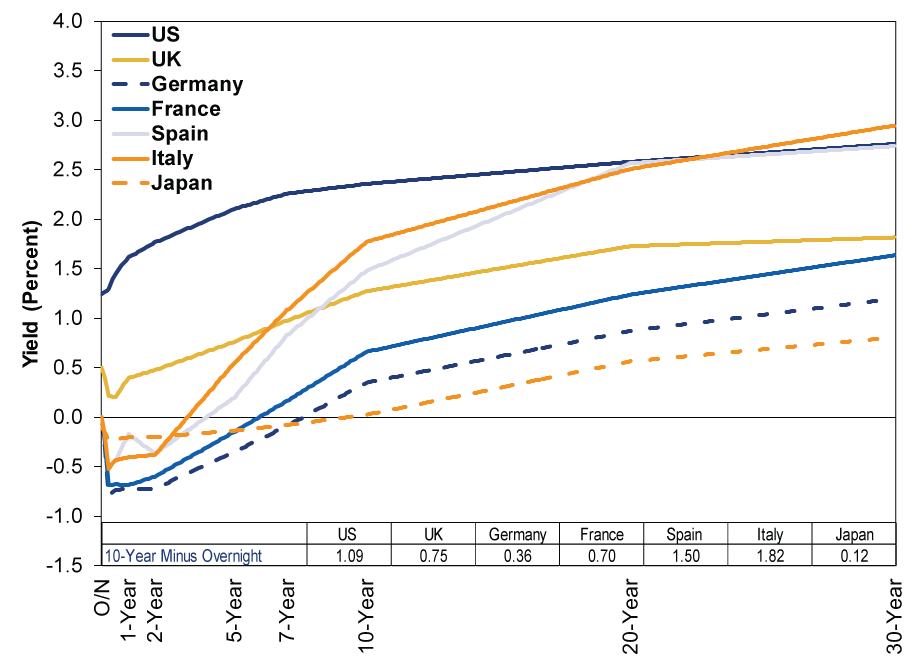
Importantly, even when one country—including biggies like the US—flattens, you should consider more. After all, money is fungible. Big borrowers and banks can (and do) secure funding cross-border, hedging for currency risk. Thus, seeing credit markets’ true health requires looking at yield curves globally. Today, as Exhibit 4 illustrates, major yield curves abroad are positively sloped. In addition, most spreads between 10-year sovereign yields and overnight rates are positive. (Exhibit 4 inset table.)
Exhibit 4: Selected Global Yield Curves and Spreads
Source: FactSet, as of 11/27/2017.
Another way to track global credit conditions is by pooling bond yield data from all developed markets and weighting them by GDP to form a single global yield curve. When you do so presently, you find a positive global yield spread—unsurprising, we guess, when you look at the major nations’ individual spreads above. But we note it here for the record.
In our view, the focus on the yield curve is a step in the right direction in the sense the conversation is at least focusing on a fundamentally important factor. (Unlike all the rate-hike handwringing and taper terror before, which didn’t acknowledge the yield curve’s importance.) That said, worrying over the yield curve today sure seems premature to us.
If you would like to contact the editors responsible for this article, please message MarketMinder directly.
*The content contained in this article represents only the opinions and viewpoints of the Fisher Investments editorial staff.
Get a weekly roundup of our market insights
Sign up for our weekly e-mail newsletter.

You Imagine Your Future. We Help You Get There.
Are you ready to start your journey to a better financial future?

Where Might the Market Go Next?
Confidently tackle the market’s ups and downs with independent research and analysis that tells you where we think stocks are headed—and why.
Related Resources
-
In The News In Orbit? On Tech Sentiment and IPOs2026-05-22
-
Market Analysis Global Bond Calamity Calls for Calm Perspective2026-05-22
-
Expert Commentary This Week in Review | UK Politics, Fed Developments, IPOs
 2026-05-22
 -
Market Analysis CPI Sheds Light on Britain’s Price ‘Cap’ Conundrum2026-05-20


Learn More
Learn why 200,000 clients trust us to manage their money and how Fisher Investments and its affiliates may be able to help you achieve your financial goals.
As of 3/31/2026
New to Fisher? Call Us.
Contact Us Today