Personal Wealth Management / Market Analysis
Is the Oft-Rumored but Rarely Seen Bond Bear Finally Here?
Some perspective on bond bear market fears and long-term interest rate volatility.

So much for bears hibernating in winter. Every January, like clockwork, the bond bluster begins anew. Pundits say this will be the year the bond market finally faces its great reckoning, with yields soaring as a bloody bond bear market begins. We saw it last year, with most observers sure long rates would zoom as the Fed raised short rates. Didn’t happen—10-year US Treasury yields finished 2017 five basis points below where they began it.[i] Now the bond bears are at it again, and this time, they have an actual bump in yields to point to. In 2018’s first six trading days, 10-year yields have risen from 2.41% to 2.55%, their highest level since last March.[ii] Cue the warnings. One famous bond guru said the rise “confirmed” a bond bear market. Another warned markets haven’t priced in the Fed’s shrinking balance sheet or other global central banks slowing asset purchases. Piling on, some unnamed sources told Bloomberg China is leaning toward slowing or stopping its purchases of US Treasurys. The thing is, we have heard all of this before, and none of it caused a bond market bloodbath. We are skeptical this time is different, and we think long-term interest rates are likely to surprise everyone by being quite boring this year, with no big moves in either direction.
First, some context. In essence, everyone is getting lathered up over a 15 basis-point move and presuming six days dictate the year—a bond-market version of the January Effect, we guess.
Exhibit 1: A Bond Market Cub?
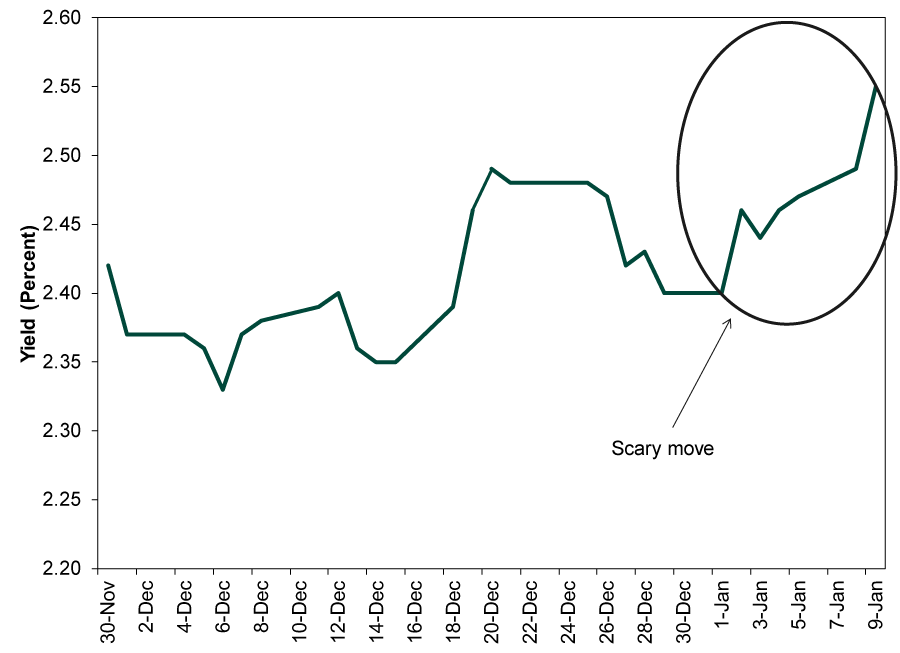
Source: FactSet, as of 1/10/2018. 10-year US Treasury yield (constant maturity), 11/30/2017 – 1/9/2018.
But is 15 basis points in 6 trading days really so massive? In 2016 and 2017—a period when 10-year yields rose just 13 basis points cumulatively—we had nine six-day moves larger than that. They turned out to be mere noise during a long flat stretch.
Exhibit 2: Recent Volatility in Perspective
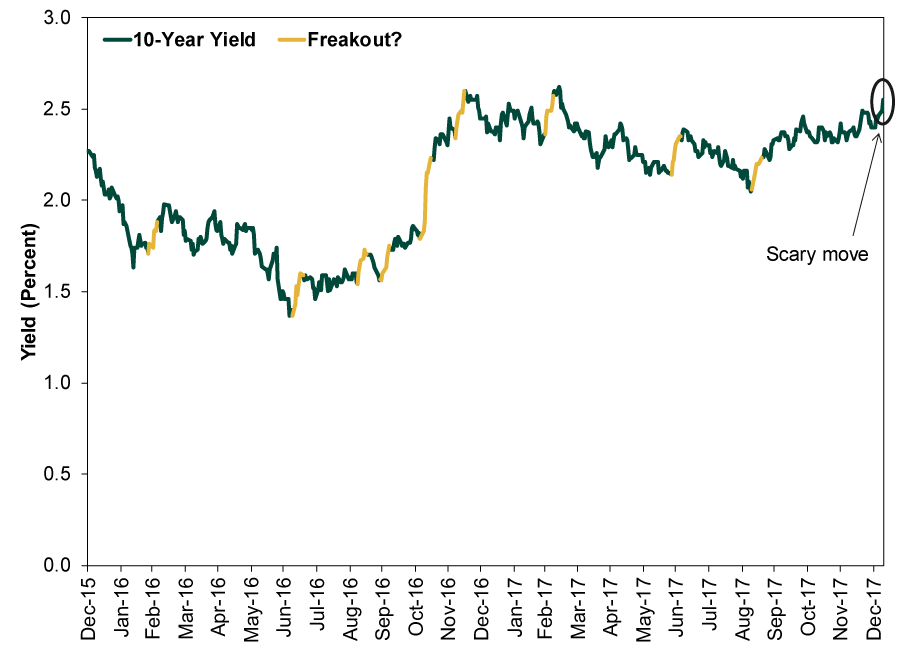
Source: FactSet, as of 1/10/2018. 10-year US Treasury yield (constant maturity), 12/31/2015 – 1/9/2018.
That alone doesn’t mean this latest spate of volatility is temporary, but it illustrates the importance of not jumping to conclusions. Just as stock investors should wait a few months to be sure a downturn is a real bear market, not a sentiment-fueled correction, so should bond investors be wary of making too much of short term moves. Getting whipsawed is painful, regardless of the asset class.
To determine whether this move is also a blip, it is important to understand why long rates were flattish last year. When the year began, most expected long rates to rise as the Fed hiked short rates. Yet this misperceives how bond markets work. Long and short rates don’t move hand-in-hand. The Fed controls overnight rates, but the market sets long rates. Like all assets, they move with supply and demand. Supply was benign last year, with a chunk of the market locked up on central bank balance sheets and issuance tame. As for demand, the chief driver is inflation expectations. At their most basic, long-term interest rates are a function of the real interest rate (basically the developed world’s cumulative growth rate, with some variance by country) plus or minus an inflation premium. As with any lender, bond investors want a high enough interest rate to keep their purchasing power from declining over the bond’s lifetime. So as inflation expectations rise and fall, so does the market’s demanded inflation premium.
Fed rate hikes are anti-inflationary—especially in a low-inflation environment. Last year, while the Fed raised rates three times, inflation slowed, creating the perception that central bankers successfully contained inflation risks. Investors demanded less of a premium, so long rates drifted a tad lower. This isn’t unprecedented. During most of the last tightening cycle, long rates stayed benign—even as the Fed raised rates at 17 straight meetings.
Exhibit 3: We’ve Seen This Movie Before
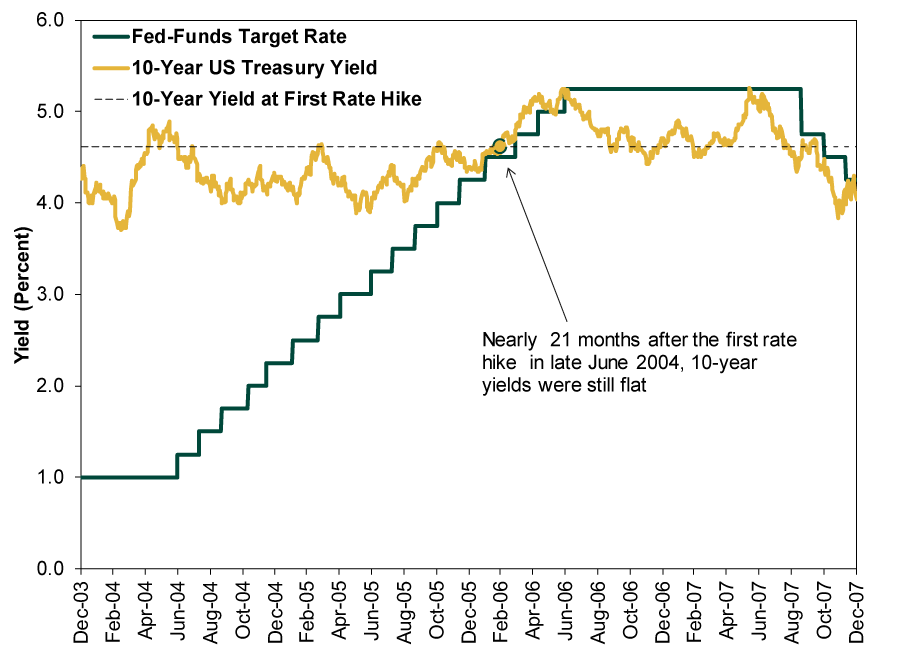
Source: FactSet, as of 1/23/2017. 10-year US Treasury yield (constant maturity) fed-funds target rate, 12/31/2003 – 12/31/2007.
We expect 2018 to go largely the same, especially if the Fed continues raising short rates (always unpredictable). As long rates crept lower while the Fed raised short rates three times, the yield curve flattened. Accordingly, lending slowed—with business lending bearing the brunt of it—and broad M4 money supply growth slowed from 2016. Inflation is always and everywhere a monetary phenomenon, as Milton Friedman preached throughout the mid-20th century, and slower growth in the quantity of money tamps down inflation. You have less money chasing more goods and services than you otherwise might, preventing substantial price increases.
Some argue inflation expectations are higher, citing the slightly wider TIPS spread, or the difference between nominal bond yields and the Treasury Inflation Protected Security (TIPS) yields for the same maturities. This is a sensible, market-based way to gauge inflation expectations. However, it is worth noting higher TIPS spreads earlier in this bull market didn’t coincide with higher inflation.
Exhibit 4: 10-Year TIPS Spreads and Inflation
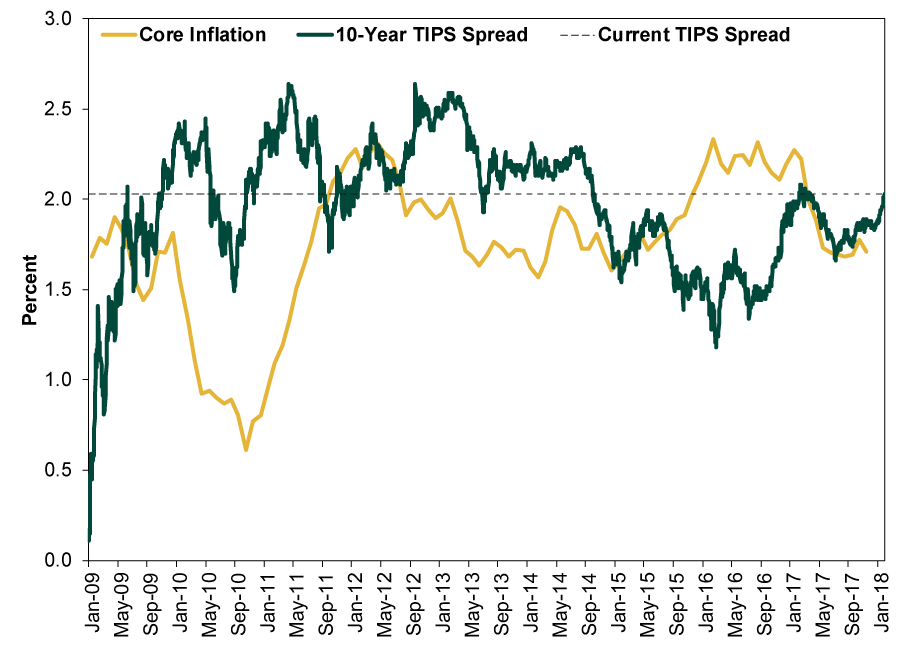
Source: FactSet, as of 1/10/2018. 10-year TIPS spread, daily, 1/1/2009 – 1/10/2018; y/y percentage change in CPI Ex. Food and Energy, monthly, January 2009 – November 2018. Core inflation used in headline to omit skew from the oil price crash.
While inflation expectations influence long-term bond yields, it isn’t fair to say inflation expectations drive inflation—it is a monetary phenomenon, not a psychological one. The yield curve is the predominant inflation influence. Expectations influence the long end of the curve, but the Fed sets the short end. As long as the yield curve doesn’t steepen a ton and inspire banks to lend a lot more, we expect inflation—and the inflation premium—to stay benign.
Many argue China is the linchpin, believing Chinese purchases of US Treasurys are the reason long-term interest rates stayed near generational lows since the financial crisis, even as US debt surged. But if China is so important to US Treasury yields, why did yields tumble, overall and on average, as China dumped US Treasurys from 2014 – 2016? Exhibit 5 shows 10-year yields alongside Chinese holdings and the sum of Chinese and Belgian holdings, as China is well-known for executing many of its Treasurys through its Belgian proxy. So whether or not the rumors about China’s intentions are true, we are skeptical it will have much impact.
Exhibit 5: China’s Interest Rate Influence Is Overrated
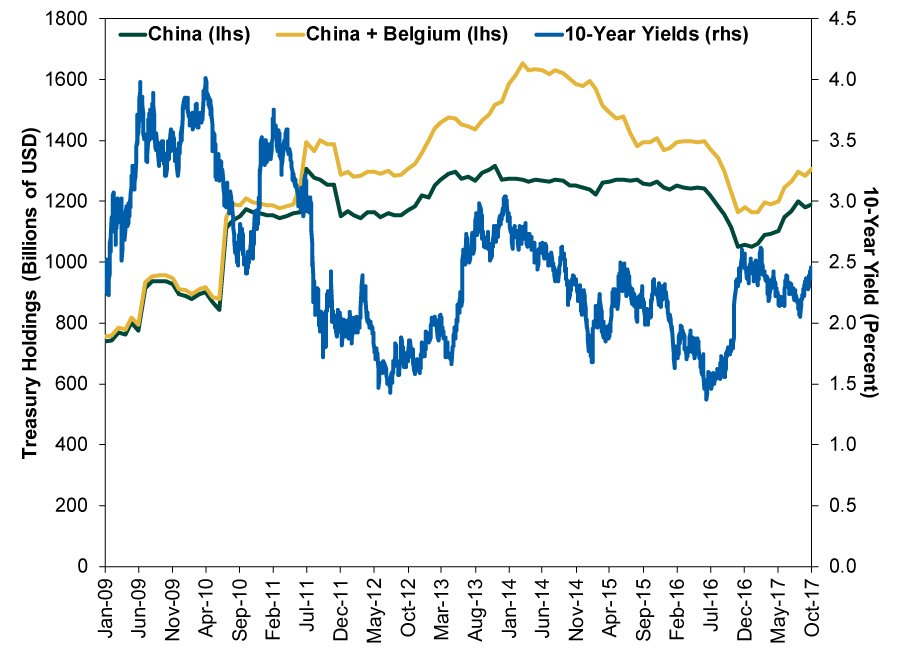
Source: FactSet, as of 1/10/2018. 10-year US Treasury yield (constant maturity), daily, 1/1/2009 – 10/31/2017; Chinese and Belgian holdings of US Treasurys, monthly, January 2009 – October 2017.
Still others argue global central bank policy spells trouble. Some wag an accusatory finger at the Fed, citing its plan to shrink its balance sheet. But this was publicly announced to great fanfare a couple months ago, and the pace is glacial. Thinking this would somehow send Treasury rates soaring is to presume one of the world’s most liquid markets is near-totally inefficient, blissfully unaware of proclamations made by the world’s most watched monetary body. While we agree markets aren’t perfectly efficient and rational in the short run, we have a hunch they are better than that. It is true the ECB and BoJ are also slowing their purchases, but they did so all last year, announced or no. We doubt the continuation of an existing policy would be suddenly detrimental. Here, also, we remind you that when the US slowed bond purchases in 2014, 10-year yields fell. Again, maybe it is different this time. But presuming that is the case and yields are set to skyrocket on six days’ small moves is a stretch.
In our view, most bond market jitters stem from a fundamental misperception: that the last several decades of falling/low long-term rates are an aberration, and sooner or later, long rates must revert to some higher mean. This seems largely tied to memories of double-digit long rates in the late 1970s and early 1980s as the Fed tried to contain the inflation that arose from Nixon’s price controls and some severe Fed blunders. If you look at the whole of US interest rate history, however, it seems pretty clear that burst of higher rates was the aberration—not the calmer decades that followed. Far be it from us ever to call any market environment “normal,” as that implies averages have some predictive power, but there is no logical reason that rates must be higher. As long as inflation is tame and supply drivers are benign, long rates should stay contained.If you would like to contact the editors responsible for this article, please message MarketMinder directly.
*The content contained in this article represents only the opinions and viewpoints of the Fisher Investments editorial staff.
Get a weekly roundup of our market insights
Sign up for our weekly e-mail newsletter.

You Imagine Your Future. We Help You Get There.
Are you ready to start your journey to a better financial future?

Where Might the Market Go Next?
Confidently tackle the market’s ups and downs with independent research and analysis that tells you where we think stocks are headed—and why.
Related Resources
-
Market Analysis On the June Inflation Cooldown2026-07-14
-
Expert Commentary 3 Things You Need to Know This Week | US Inflation, China GDP, US Retail Sales
 2026-07-13
 -
Weekly Wrap-Up Fisher Investments Reviews: Last Week in Markets—July 6 - July 102026-07-13
-
Expert Commentary This Week in Review | Global PMIs, SpaceX, RMD Planning
 2026-07-10


Learn More
Learn why 210,000 clients trust us to manage their money and how Fisher Investments and its affiliates may be able to help you achieve your financial goals.
As of 6/30/2026
New to Fisher? Call Us.
Contact Us Today