Personal Wealth Management / Economics
Lessons From PMIs and Other Goodies
This economic downturn’s unique characteristics have a few key implications.

Investors got 2021’s first US economic data release Tuesday, when the Institute for Supply Management (ISM) announced its manufacturing purchasing managers’ index (PMI) for December jumped to 60.7 from November’s 57.5, beating expectations for a mild slowdown.[i] (As with all PMIs, readings over 50 indicate expansion.) Forward-looking new orders hit an astounding 67.9, and output rose to 64.8.[ii] Surprising many, this expansion happened even as several states and metro areas were tightening lockdowns. Meanwhile, ISM’s services PMI doesn’t hit until tomorrow, but IHS Markit’s version ticked lower, signaling a slowdown. This divergence is unusual for a recession, and it isn’t the only thing making 2020’s economic contraction unique—a factor that holds a few takeaways for investors, in our view.
History will remember last year’s economic decline as a recession. The official arbiters, the National Bureau of Economic Research, already declared it one. But from a qualitative standpoint, we think the decline’s nature matters, too. Last year’s downturn had a well-known, unique cause: In hopes of slowing COVID-19’s spread, governments nationwide (and worldwide) ordered the closure of most face-to-face businesses. When the first wave of lockdowns happened in March, that included a lot of manufacturing facilities as well as shops, restaurants and personal services. But by the time the late-year virus surge triggered a new wave of lockdowns, officials seemed to realize factories could stay online provided employees maintained social distance and had adequate personal protective equipment. They were allowed to remain open—unlike restaurants, hair salons and a host of others. Online shopping also supported demand for physical goods as people adapted to stay-at-home life. So we ended up with a forced decline in services activity, while manufacturing fared ok after an initial drop.
More traditional recessions don’t materialize as suddenly or sharply. The typical recipe: As an expansion rolls on and the world gets more optimistic, businesses tend to build up excess as their expectations get too high. They launch big new projects, ramp up output, add headcount and all the rest as they see only sunlit uplands and can’t fathom bad times arriving in the near future. Meanwhile, in an effort to contain that froth, central bankers often overshoot, jacking short rates above long rates and inverting the yield curve. That starts a reset in which funding dries up, forcing businesses to get lean and mean to make it through. They slash investment and production and work through big inventories, with the goal of being able to do more with less once everyone has worked off their collective bloat. You can see this in the steady decline in inventories and capacity utilization over the entirety of a recession. Both usually bottom out alongside GDP. This time, inventories and capacity utilization took an immediate hit before beginning a sharp recovery. Neither is back at breakeven yet, but both have rebounded far faster than if this were a traditional recession, as Exhibits 1 and 2 show.
Exhibit 1: Capacity Utilization Is Breaking With History
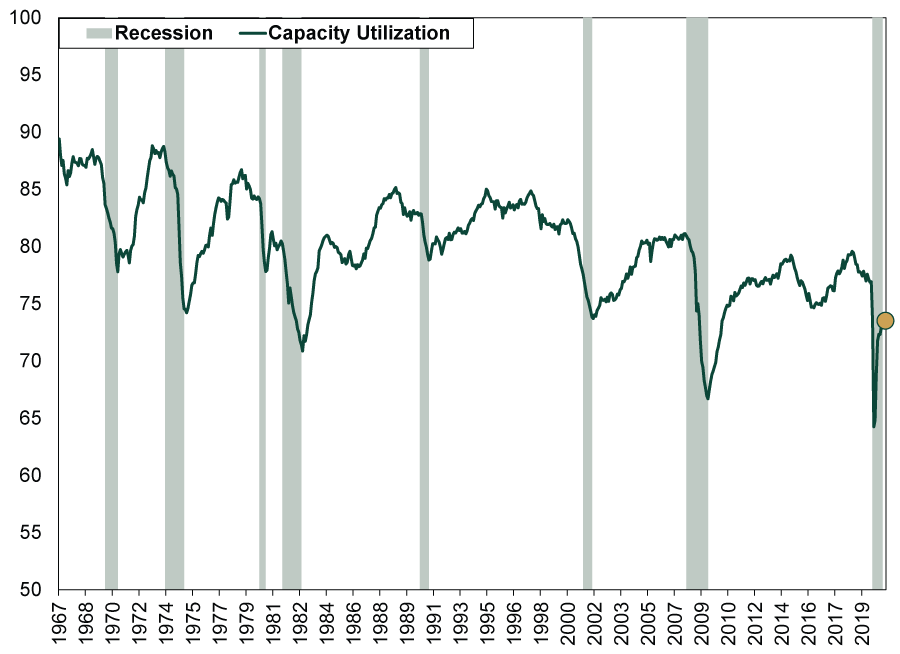
Source: St. Louis Federal Reserve, as of 1/5/2021. Monthly capacity utilization, January 1967 – November 2020. Recession shading uses NBER business cycle dates.
Exhibit 2: So Are Private Inventories
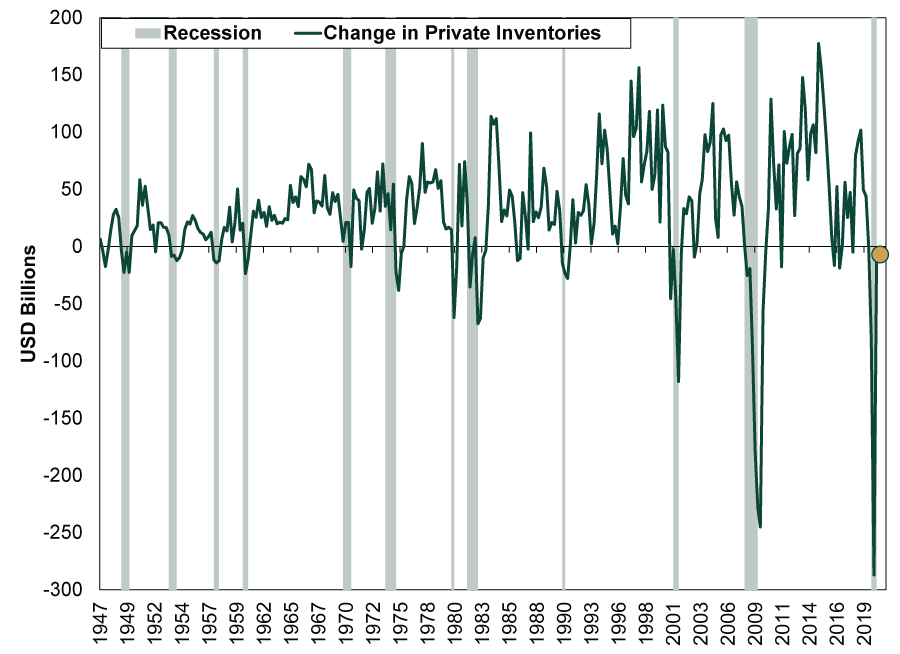
Source: St. Louis Federal Reserve, as of 1/5/2021. Quarterly real change in private inventories (in 2012 USD), Q1 1947 – Q3 2020. Recession shading uses NBER business cycle dates.
In our view, this is a good indication that this recession wasn’t a typical reset. If it were—if businesses were working off frothy excess—then inventories and capacity utilization wouldn’t be so resilient. Companies would still be trimming the fat wherever possible and making all the tough decisions. Yes, some businesses—particularly mom-and-pop shops and restaurants—are doing that. But that is so they can hopefully stay alive while waiting for economic life to return to normal. Consumer demand, meanwhile, appears to be consolidating around large retailers and restaurant chains. Winners and losers abound, but they are mostly an outgrowth of COVID policy, not businesses struggling to work though typical pre-recession excess.
For investors, this isn’t just an academic curiosity. It also has implications for equity style leadership. After traditional recessions and their accompanying bear markets, value stocks usually lead, as they are the ones investors fear won’t survive the long, painful reset and bank lending squeeze. They suffer disproportionately toward the end of the bear market, then bounce high. Growth stocks, meanwhile, are seen as stodgy by comparison and fall out of favor. Their time usually comes later in the bull market, after value’s initial burst wears off and stodgy starts looking more attractive—especially to those who were too scarred from the bear market to participate in the bull market’s first couple of years. This history is why value’s late-2020 leadership burst generated so much enthusiasm in headlines—pundits saw it as a sign the recovery was finally cooking for real.
But if you see the economic downturn as a sharp contraction in activity that didn’t really reset anything, then you would logically expect the trends that reigned before the contraction to continue in its aftermath until the cycle resets in the more traditional manner. In our view, that suggests growth stocks are likely to keep their leadership, overall and on average, making value’s recent burst merely the latest in a long streak of short countertrends.
The big mistake value’s cheerleaders are making today, in our view, is focusing on the what rather than the why and how. It is a lesson in the need to look under the hood and find the interesting nuggets others are missing.
If you would like to contact the editors responsible for this article, please message MarketMinder directly.
*The content contained in this article represents only the opinions and viewpoints of the Fisher Investments editorial staff.
Get a weekly roundup of our market insights
Sign up for our weekly e-mail newsletter.

You Imagine Your Future. We Help You Get There.
Are you ready to start your journey to a better financial future?

Where Might the Market Go Next?
Confidently tackle the market’s ups and downs with independent research and analysis that tells you where we think stocks are headed—and why.
Related Resources
-
Market Analysis The New Tariffs in Town Are Still Old News2026-07-24
-
Expert Commentary This Week in Review | Market Volatility, Tariffs, SpaceX
 2026-07-24
 -
Expert Commentary Why Ken Fisher Is Optimistic About European Stocks
 2026-07-23
 -
Economics A Summertime Check-in on US Consumers2026-07-23


Learn More
Learn why 210,000 clients trust us to manage their money and how Fisher Investments and its affiliates may be able to help you achieve your financial goals.
As of 6/30/2026
New to Fisher? Call Us.
Contact Us Today