Personal Wealth Management / Market Analysis
Low Bond Rates Don’t Yield Low Stock Returns
Historically low global bond yields don't mean stocks are in trouble.

Are stocks doomed to poor returns for the next decade? Some say yes! Now, maybe this isn't a shocking development to you, because folks have fretted equity markets' long-term prospects for years-but it is grabbing headlines anew, with pundits arguing stocks don't have much room to rise amid historically low sovereign debt yields worldwide. However, the historical evidence refutes the notion stocks can't enjoy big gains during long stretches of "low" interest rates-a handy reminder for investors today.
Those arguing stocks' outlook in upcoming years isn't grand largely hinge their argument today on the bond market. Yields on sovereign debt have fallen to record lows globally, headlined by the German 10-year bund and Swiss 30-year debt now carrying slightly negative yields. Some, rather bombastically, say global yields are at their lowest levels in 500 years (despite the broad historical record not documenting bond yields in 1516 terribly well). Now, a friendly reminder: A bond's yield isn't the same as its total return. Total return accounts for both yield and price movement. Because a bond's price and yield are inversely correlated-when prices fall, yields rise, and vice versa-price movement also impacts a bond's value.
With sovereign debt yields historically low, some expect spillover effects on stocks. In particular, some cite the equity risk premium (ERP)-the spread in historical returns between investing in "riskier" (read: more volatile) assets like stocks vs. "safer" (read: less volatile) securities like Treasurys. (We use scare quotes because safe doesn't actually exist in capital markets.) The ERP, these folks figure, is the premium you get for enduring more volatility. The long-run ERP between the S&P 500 Total Return Index and the US 10-year Government Bond Total Return Index is 4.7 percentage points.[i] So extrapolating the logic here, if sovereign debt yields remain around their current levels, stocks won't offer much more than middling single digit returns for a long while-considerably lower than long-term averages.
However, history counters this narrative. For one, ERP's forward-looking powers are nonexistent. Consider a period when past Treasury yields were comparable to the present. From 1930 - 1960, the 10-Year Treasury averaged 2.63%[ii]-during the current bull, it is averaging 2.50%.[iii] Breaking the 1930s, 40s and 50s down by decade, the historical ERP wasn't very telling about stock performance. (Exhibit 1)
Exhibit 1: The ERP Isn't Indicative
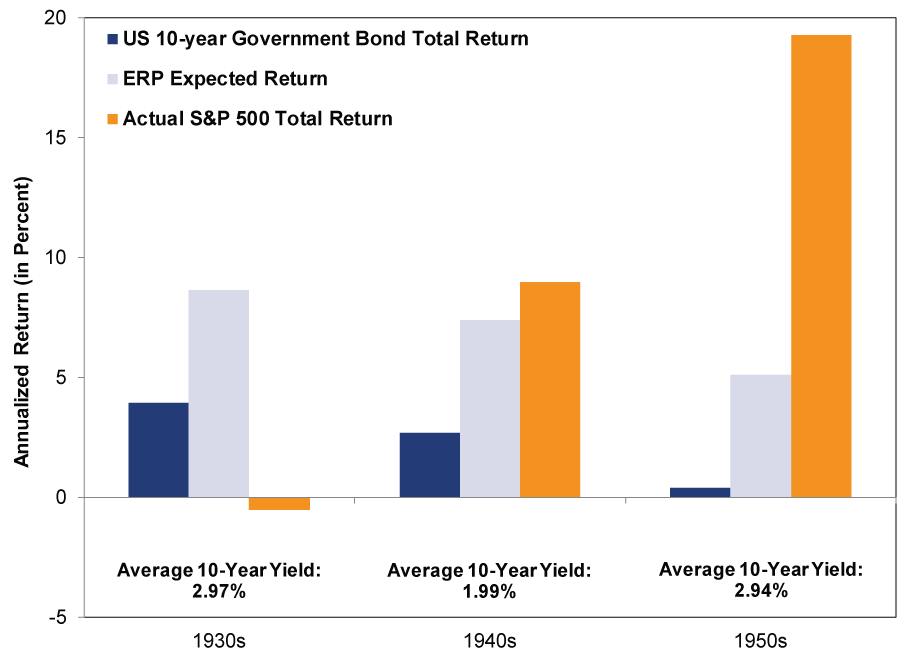
Source: Global Financial Data, as of 6/15/2016. ERP Expected Return is sum of US 10-year Government Bond Total Return and historical ERP of 4.7 percentage points.
During the 1930s, a period encompassing the Great Depression and the 1937-1938 economic recession, stocks offered less than expected compared to bonds. They can also offer much, much more as the 1950s show. Regardless, being in a "low" interest rate environment doesn't appear to be automatically good or bad for stocks, which lays waste to the ERP's predictive power-or really any mathematical attempt to foresee returns in the distant future.
Likewise, higher interest rates don't mean stocks rise commensurately. As Exhibit 2 highlights, the 1970s featured sky-high interest rates with low stock returns, while the 1980s experienced high rates and high returns-there is no set relationship between interest rates and stock market returns.
Exhibit 2: Interest Rate Levels Don't Dictate Stock Returns
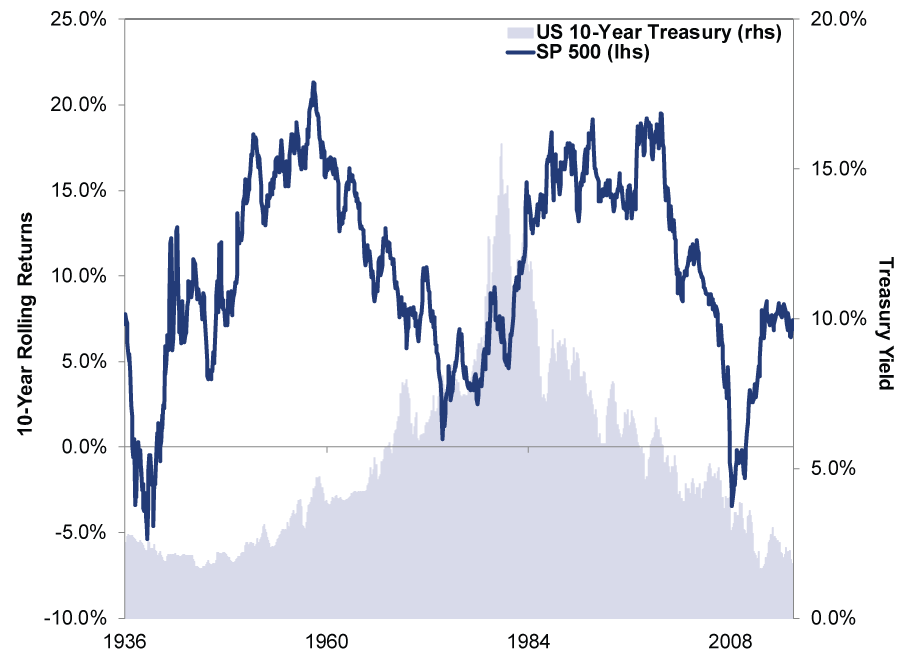
Source: Global Financial Data, as of 6/15/2016.
Also consider that stock returns don't follow a smooth, upward trajectory. Their 10.0% annualized return is an average that includes both bull and bear markets. Heck, even in the middle of the dismal 1930s there was a massive bull market. During that bull (June 1932 - March 1937), 10-year yields ranged between a high of 3.76% at the outset to a low of 2.46% at its close.[iv] Meanwhile, stocks annualized 35%.[v]
Broadly speaking, we caution investors from putting too much stock in-or even making-forecasts about the distant future. Many folks are predicting stocks' returns will fall well short of their historic annualized average-due to myriad reasons-for years to come. Yet in general, long-term forecasts aren't very accurate. Consider the Congressional Budget Office's (CBO) annual release of its 10-year budget projection, hazy estimates headlines usually spin as imminent. Back in 2006, the CBO forecasted a budget surplus of $73 billion in 2015. Ten years later, they updated the actual 2015 figure based on reality: a deficit of -$439 billion. At the beginning of this bull market in 2009, it was fashionable to claim investors should expect far lower returns going forward than their historical averages. Yet the S&P 500 has annualized 19.0% in the seven-plus years since, and the Merrill Lynch Corporate/Government 7-10 Year Bond Index 7.2%. Those are pretty much in line with bull market history. Suffice it to say, this isn't an isolated occurrence.
We don't point these out because we are a bunch of meanie know-it-alls.[vi] Rather, we believe nobody can reliably predict what the world will look like in the far future. If you know nothing about future stock and bond supply-huge influences on pricing in the long run-how can you accurately forecast stock returns? Markets don't look more than 30-ish months ahead, with a particular focus on the next 12-18. Over these shorter periods, we can make a forecast based on economic, political and sentiment drivers influencing demand. However, looking more than several years into the future is an exercise in modeling-and using the past to make a call about the future is a fallacy.
It seems to us today's forecasts of a low-return, long-term future are heavily influenced by recency bias. For one, stocks have been frustratingly flattish over the past year or so. Interest rates are also extremely low globally-even negative in parts of Europe-which many view as justification for that flatness. But in our view, this flatness is a function of the past correction. Corrections come and go unpredictably and don't foretell markets' direction or magnitude. Uncertainty stoked that correction and weighed on markets, but uncertainty should dissipate throughout the year, allowing investors to see the better-than-appreciated reality around them-a bullish development over the actually foreseeable future.
[i] Source: Global Financial Data, as of 6/15/2016. S&P 500 annualized return is 10.0%, from December 1926 - December 2015. The US 10-year Government Bond Total Return Index annualized return is 5.3%, from December 1925 - December 2015. The difference between the two is the ERP.
[ii] Source: Global Financial Data, as of 6/15/2016.
[iii] Ibid.
[iv] Ibid.
[v] Ibid.
[vi] Others may disagree.
If you would like to contact the editors responsible for this article, please message MarketMinder directly.
*The content contained in this article represents only the opinions and viewpoints of the Fisher Investments editorial staff.
Get a weekly roundup of our market insights
Sign up for our weekly e-mail newsletter.

You Imagine Your Future. We Help You Get There.
Are you ready to start your journey to a better financial future?

Where Might the Market Go Next?
Confidently tackle the market’s ups and downs with independent research and analysis that tells you where we think stocks are headed—and why.
Related Resources
-
Market Analysis The New Tariffs in Town Are Still Old News2026-07-24
-
Expert Commentary This Week in Review | Market Volatility, Tariffs, SpaceX
 2026-07-24
 -
Expert Commentary Why Ken Fisher Is Optimistic About European Stocks
 2026-07-23
 -
Economics A Summertime Check-in on US Consumers2026-07-23


Learn More
Learn why 210,000 clients trust us to manage their money and how Fisher Investments and its affiliates may be able to help you achieve your financial goals.
As of 6/30/2026
New to Fisher? Call Us.
Contact Us Today