Personal Wealth Management / Market Analysis
Major Nations’ Yield Curves Aren’t Sending Warning Signals
The meaningful parts of major nations’ yield curves aren’t close to inverting anywhere.

According to a slew of recent reports, yield curves globally are flattening, particularly the spread between 10-year and 2-year yields. That has pundits warning of a worsening economic outlook—just as central banks seem set to “tighten” policy. To adherents, that flattening yield curve hints at an approaching, poisonous cocktail for this bull market. But here is the problem with this notion: The spreads folks point to, like the 10-year to 2-year and the 30-year to 20-year yield spreads, aren’t very relevant to growth, potentially leading you to errant conclusions. Viewed properly, global yield curves reveal a far more benign explanation—and reality.
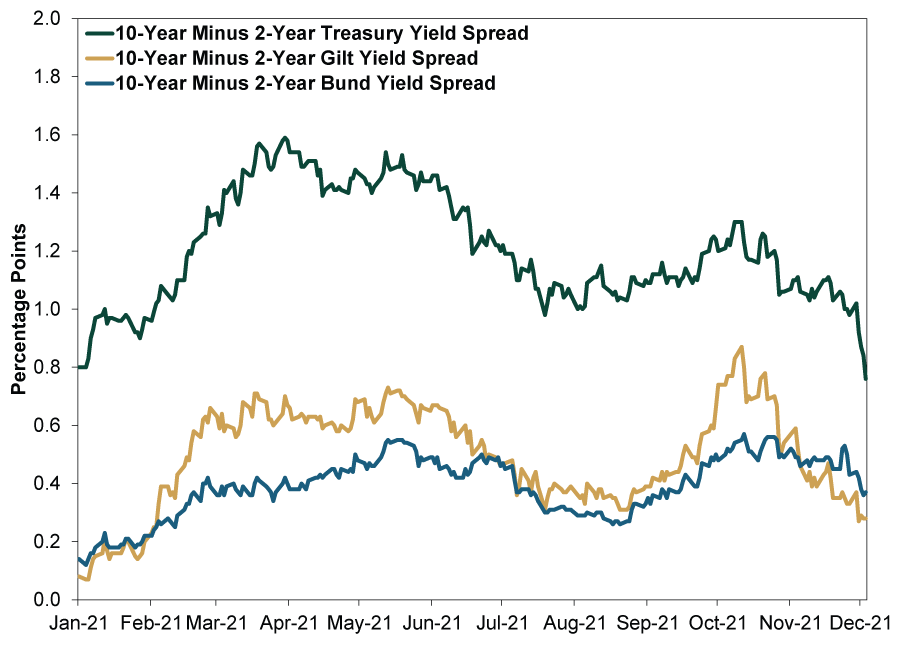
It is true 10-year yields have dropped in recent weeks, while 2-year yields have risen, compressing one measure of the yield curve spread. In the US, the 10-year Treasury yield fell from mid-October’s high of 1.61% to 1.34%, and the 2-year yield doubled from 0.31% to 0.59%.[i] Hence, this spread has narrowed from 1.30 percentage points in October to 0.76 now.[ii] Other major developed world bond markets have followed suit. As Exhibit 1 shows, the UK’s 10-year to 2-year gilt yield spread shrank from 0.87 percentage points to 0.28 and the German bund’s from 0.57 to 0.37.
Exhibit 1: 10-Year to 2-Year Yield Curves
Source: FactSet, as of 12/6/2021. 10-year minus 2-year US Treasury, UK gilt and German bund yield spreads, 1/2/2021 – 12/3/2021.
Meanwhile, the 30-year Treasury yield fell to 1.96% in late October, sliding ever so slightly below the 20-year’s 1.98%—an “inversion” to some.[iii] It has inverted a bit more since, with the 30-year now at 1.69% versus the 20-year’s 1.77%.[iv] But 20-year Treasurys are relatively illiquid—last year’s reintroduction was the first since 1986—so we wouldn’t read much of anything into this. But some pundits have taken note and run with it, saying the anomaly portends global yield curve flattening generally. While there is a range of speculation about what underpins the flattening—from markets pre-pricing potential rate hikes on the short end of the curve to slower future inflation on the long end—there is a general consensus about what it means: slower growth, perhaps even economic contraction, ahead.
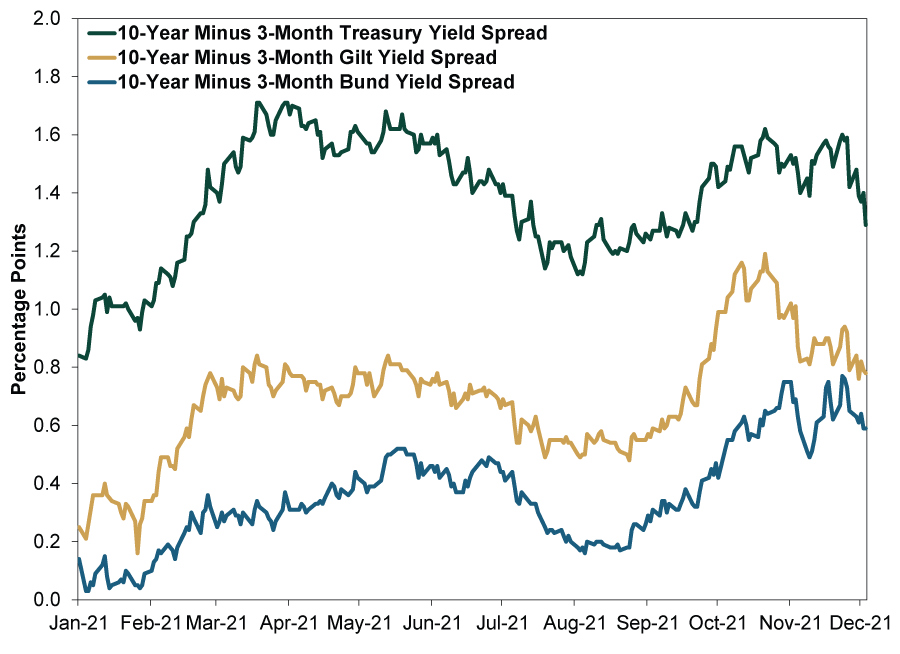
That is one way to interpret yield curve moves, as they reflect future growth and inflation outlooks. But there is another, more direct—and, in our view, more correct—way to view them: as a monetary transmission mechanism. Banks borrow short-term—think of your (likely miniscule) deposit rate—to fund long-term loans. Flatter curves, therefore, reduce banks’ potential profits on new loans—discouraging them from extending credit, an economic headwind. But very few banks will borrow at 2-year rates to fund loans. Almost none would borrow at 20-year rates to do so. They are usually tapping much shorter-term sources, so their funding costs are likely far closer to 3-month and overnight rates. The spread between 10-year and 3-month rates better reflects banks’ potential loan profits—and incentive to lend.
As Exhibit 2 shows, 10-year to 3-month yield spreads are wider. They have narrowed recently, but not alarmingly so, remaining closer to their highs for the year. 3-month US Treasury bill yields have hovered near 0% since March 2020, when the Fed cut overnight rates. So the yield curve’s latest squiggle down is due entirely to the 10-year yield’s dip, which really isn’t all that significant in the broad scheme of things. The same goes for the UK and Germany. The UK’s 10-year to 3-month gilt yield curve is still wider than any point this year before October. Germany’s yield curve remains near its widest all year.
Exhibit 2: 10-Year to 3-Month Yield Curves
Source: FactSet, as of 12/6/2021. 10-year minus 3-month US Treasury, UK gilt and German bund yield spread, 1/2/2021 – 12/3/2021.
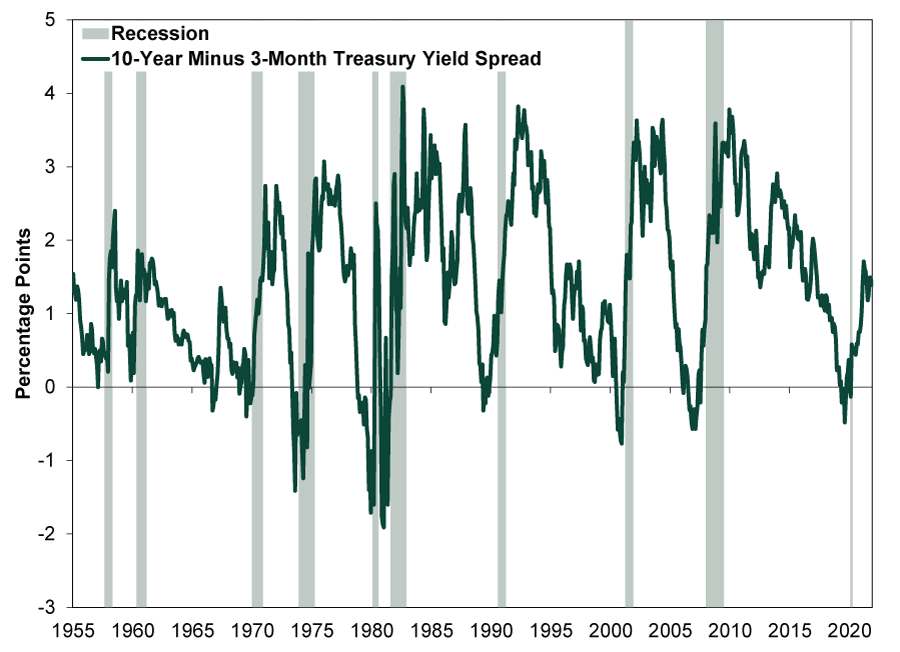
Now, these yield spreads remain historically mediocre and well off levels that led to booming lending in the past—so we don’t expect galloping loan growth from here. But the key, in our view, is that around current levels, they aren’t close to signaling recession. Although it isn’t ironclad, Exhibit 3 shows lasting, fairly significant yield curve inversion is what generally precipitates a downturn. (Also note: We don’t think 2019’s modest inversion caused 2020’s 2-month recession, which was due entirely to COVID-related lockdowns. Actually, that inversion reversed well before COVID hit.) In our view, the yield curve presently suggests ongoing, albeit pedestrian, expansion consistent with a return to pre-pandemic norms.
Exhibit 3: The Yield Curve and Recessions
Source: FactSet, as of 12/6/2021. 10-year minus 3-month US Treasury yield spread, January 1955 – November 2021.
Moderate growth is fine for stocks. They don’t need booming economic activity to rise. Modest progress with no recession on the horizon—which a moderately upward sloping yield curve, conceived correctly, points to—should be good enough.
If you would like to contact the editors responsible for this article, please message MarketMinder directly.
*The content contained in this article represents only the opinions and viewpoints of the Fisher Investments editorial staff.
Get a weekly roundup of our market insights
Sign up for our weekly e-mail newsletter.

You Imagine Your Future. We Help You Get There.
Are you ready to start your journey to a better financial future?

Where Might the Market Go Next?
Confidently tackle the market’s ups and downs with independent research and analysis that tells you where we think stocks are headed—and why.
Related Resources
-
Economics Q2 US GDP’s Stealthy Strength2026-07-31
-
Expert Commentary This Week in Review | Fed Meeting, US GDP, Eurozone GDP
 2026-07-31
 -
Market Analysis Don’t Fret the EU’s Low Summertime Gas Storage Levels2026-07-31
-
Economics On Fires and GDP2026-07-30


Learn More
Learn why 210,000 clients trust us to manage their money and how Fisher Investments and its affiliates may be able to help you achieve your financial goals.
As of 6/30/2026
New to Fisher? Call Us.
Contact Us Today