Personal Wealth Management / Market Analysis
No, Copper Doesn’t Diagnose Economic Health
Economic trends are far from copper’s only influence.

The doctor is in—Doctor Copper, that is. The metaphorical Economics PhD with an allegedly uncanny forecasting ability is back in headlines this month, as many argue copper prices’ recent slide signals a nasty recession looms. Yet as leading indicators go, copper’s record is pretty spotty. We don’t recommend relying on it to determine what the economy is up to.
The case for copper’s prescience might seem intuitive. Conventional wisdom says that a humming economy will have widespread construction of homes, offices, factories, warehouses and stores—driving demand for copper, which is a key construction component. Therefore, if copper prices drop, it signals falling demand, which means construction is down, which means the economy is sagging.
But this logic doesn’t really hold up in developed-world economies, where services are much more important to growth than construction and physical goods. Many decades ago, when heavy industry and infrastructure had larger economic roles, it made sense to view copper as a leading indicator. When pioneering the Leading Economic Index (LEI) in 1938, economists Wesley C. Mitchell (founder of the National Bureau of Economic Research, which dates US business cycles) and Arthur Burns included copper on their initial list of the most telling components. But by the time LEI was reconfigured in 1950, copper was out. The more growth came from services and intellectual property, the less of a role copper played.
Don’t take our word for it, though. Exhibit 1 shows monthly copper prices since modern data begin in 1987. As you will see, while copper fell just before recessions in 2001 and 2008, it rose just before 1990’s recession and 2020’s lockdown-induced decline. Moreover, there are several drops that occurred nowhere close to a recession. 1994 – 1998 was a smashing time for the US economy, with robust growth and booming information technology. The multiyear slide off mid-2011’s record high occurred during a record-long economic expansion. Anyone heeding Dr. Copper’s supposed signals at these times would have missed significant stock returns.
Exhibit 1: Dr. Copper Tells a Whopper
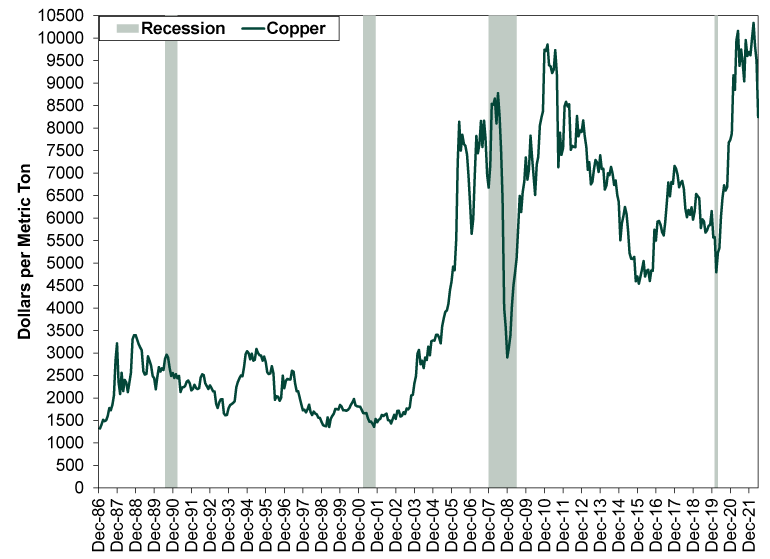
Source: FactSet, as of 7/19/2022. Copper spot price, month-end, 12/31/1986 – 6/30/2022. Recession dating from the National Bureau of Economic Research.
The central fallacy underlying Dr. Copper is pretty simple: Commodity prices move on supply as well as demand. The general commodity price life cycle goes like this: High prices drive investment in new mines. A lot of it. New mines take years to come online, so supply remains short in the near term, keeping prices elevated—and incentivize even more investment. Eventually, new mines come online, helping prices ease. And then more, and more, and more, as all the prior investments come to fruition. Soon there is a supply glut, which tanks prices, leading miners to cut costs drastically. That eventually brings a supply shortage, which raises prices, which starts the cycle anew. The early-to-mid 2010s’ slide is a prominent example of this so-called supercycle—it took several years for the supply glut to work its way through the system, laying the groundwork for the recovery in the decade’s latter half.
Now, like all liquid assets, copper is also prone to sharp sentiment-fueled moves. For a while now, sentiment toward China’s economy has influenced copper prices at times, due in large part to construction and infrastructure’s relatively larger role there. So when Chinese hard-landing fears spike, copper can take a hit. We suspect this bears much of the blame for copper’s recent slide, which coincides with global dread of China’s Omicron lockdowns sending its economy on a downward spiral. Note, too, that this followed an early-year spike, which was part of a global commodity price jump spurred by fears of the war in Ukraine disrupting commodity supply chains and sparking shortages. Those fears have now eased, bringing all commodity prices down—with copper seemingly getting an extra hit from China worries. Those should fade as the economic recovery there takes root.
Even if you don’t accept our argument, that isn’t a case for basing portfolio positioning on an economic forecast that derives from copper’s drop. All similarly liquid assets—copper included—digest information simultaneously. Whatever copper has been pricing in this year, stocks have also been pricing it in. There is no edge there. Considering both copper and stocks have had a rough go, it seems fair to reason that economic fears are registered in prices already. So if it turns out that we are in a shallow recession, there is a high likelihood stocks have already dealt with it to a very great degree. It would take something much deeper than what stocks have already priced in to cause deep declines from here. We don’t think that is probable at the moment, considering most indicators show plenty of pockets of strength are counterbalancing weak spots, but if it does become a greater risk, don’t rely on copper to tell you.
If you would like to contact the editors responsible for this article, please message MarketMinder directly.
*The content contained in this article represents only the opinions and viewpoints of the Fisher Investments editorial staff.
Get a weekly roundup of our market insights
Sign up for our weekly e-mail newsletter.

You Imagine Your Future. We Help You Get There.
Are you ready to start your journey to a better financial future?

Where Might the Market Go Next?
Confidently tackle the market’s ups and downs with independent research and analysis that tells you where we think stocks are headed—and why.
Related Resources
-
Market Analysis Kevin Warsh and the Magical Delete Button2026-06-17
-
Market Analysis The Politics and Practicalities of the Social Security Trust Fund2026-06-16
-
Market Analysis Gold Fails the Safe Haven Test Again2026-06-16
-
Expert Commentary Ken Fisher on Crypto, Inflation, AI Bubble and Annuities
 2026-06-16


Learn More
Learn why 200,000 clients trust us to manage their money and how Fisher Investments and its affiliates may be able to help you achieve your financial goals.
As of 3/31/2026
New to Fisher? Call Us.
Contact Us Today