Personal Wealth Management /
No, the Big 2019 Wasn't All About Rate Cuts and a Tariff Truce
Actually, this year was kinda normal.

Today is New Year’s Eve, and barring a late-day collapse, the S&P 500 is on course to top 30% for the year and log its best calendar-year return since 2013. The MSCI World Index, meanwhile, looks set to notch its second-highest annual return of this bull market, trailing only 2009’s initial surge. As is usual this time of year, the year-in-review retrospectives are rolling in, with most crediting Fed rate cuts and trade war U-turns for these gobsmacking returns. We don’t think so. Please allow us to set the record straight.
To say rate cuts and eased trade tensions drove this year’s returns is to ignore the year’s timeline. The Fed didn’t start cutting rates until July 31. President Trump and China didn’t start zeroing in on a phase one trade deal until autumn. As late as October, both sides were still planning to ratchet up tariffs. Meanwhile, when US markets closed on July 31, the S&P 500 was already up 21.6% on the year.[i] We get that stocks are forward-looking, but even then, crediting future rate cuts and unpredictable tariff rollbacks seems like a bridge too far. Something else was going on, in our view.
To us, that something else was the rebound from stocks’ bloodbath in December 2018, which capped a correction (a sharp, sentiment-driven pullback of around -10% to -20%) that began last September. The steep decline had most convinced this longest-ever bull market was doomed and a recession all but assured, lowering expectations dramatically—and setting the stage for a big rebound if reality proved less dire. As we now know, no 2019 recession struck. The bull market persisted. Pessimists got a positive surprise.
That correction ended on Christmas, the closest the market has ever come to bottoming at the end of the year. That meant most of the rebound would occur in 2019, making historical correction rebounds a reasonable guide for full-year return expectations. The past doesn’t predict, but stocks’ long history of strong bounces after corrections suggested said bounce would be large. As Exhibit 1 shows, world stocks’ median 12-month price gain after a correction’s low is 28%. This recovery edged that out slightly, with a 30.4% price gain.[ii] All stocks did this year was simply outpace the median by a smidge. That was enough to land stock investors a very, very nice year.
Exhibit 1: MSCI World Index Returns During and After Corrections
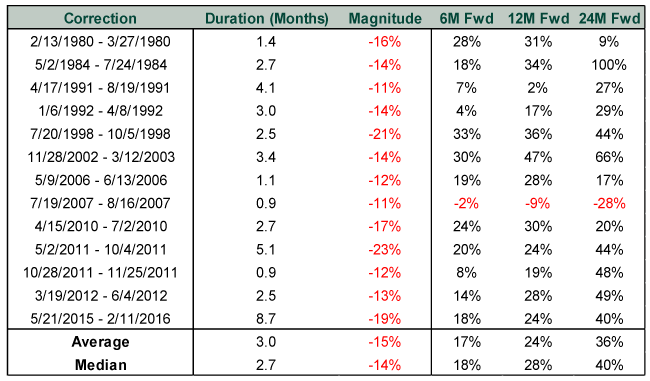
Source: FactSet, as of 12/7/2018. MSCI World Index price returns 6, 12 and 24 months after correction troughs, 2/13/1980 – 2/11/2018.
This isn’t just mere trivia. The thesis of a lot of those “thank the Fed” articles is that the rally was built on sand—it echoes everything pundits said about quantitative easing earlier in the bull. People still see it as an unstable sugar high, too detached from slow economic growth, and therefore doomed to reverse. The tariff truce, meanwhile, is allegedly an additional positive catalyst that won’t repeat. Now, we don’t think stocks are likely to repeat 2019’s returns next year. But also, we don’t think last year’s returns really support the naysayers’ thesis. For seven whole months, stocks rallied without an external catalyst. Heck, the yield curve was inverted for about half that period. The only driver they needed was just normal market behavior—folks expected a recession and we didn’t get one. Reality topped dour expectations and we got a big bounce after a big drop. So maybe the only driver they “need” next year is … normal market behavior—a typical bull market year in which reality edges out expectations and sentiment gradually warms.
So don’t buy the notion that 2019 was some sort of anomaly. Rather, it was a normal recovery from a normal (if large) bull market correction. The fact people don’t see it as such simply shows sentiment still has some room to catch up with reality. Not as much room as it had a year ago, when panic filled the air, but still some headspace.
Happy New Year!
[i] Source: FactSet, as of 12/31/2019. S&P 500 Total Return Index, 12/31/2018 – 7/30/2019.
[ii] Ibid. MSCI World Index price return, 12/25/2018 – 12/25/2019. The return with net dividends over the same period was 33.0%.
If you would like to contact the editors responsible for this article, please message MarketMinder directly.
*The content contained in this article represents only the opinions and viewpoints of the Fisher Investments editorial staff.
Get a weekly roundup of our market insights
Sign up for our weekly e-mail newsletter.

You Imagine Your Future. We Help You Get There.
Are you ready to start your journey to a better financial future?

Where Might the Market Go Next?
Confidently tackle the market’s ups and downs with independent research and analysis that tells you where we think stocks are headed—and why.
Related Resources
-
Market Analysis Why the SOX “Bear Market” Isn’t Foreboding2026-07-21
-
Politics Blunting Burnham?2026-07-21
-
Expert Commentary 3 Things You Need to Know This Week | Q2 Earnings, ECB Meeting, Trump Accounts
 2026-07-20
 -
Weekly Wrap-Up Fisher Investments Reviews: Last Week in Markets—July 13 - July 172026-07-20


Learn More
Learn why 210,000 clients trust us to manage their money and how Fisher Investments and its affiliates may be able to help you achieve your financial goals.
As of 6/30/2026
New to Fisher? Call Us.
Contact Us Today