Personal Wealth Management /
Non-Traditional Data Show What Stocks Reacted To
Mainstream data reports covering the social distancing era are still scant, but some niche, industry-specific indicators provide a handy real-time read.

As most major cities close in on the one-month anniversary of business closures and other social distancing measures to slow the spread of COVID-19, we are still some ways away from having official economic data to measure the precise negative impact. Even Wednesday’s retail sales release likely only hints at the damage. Yet neither we—nor markets—are flying blind. An array of narrow-but-speedy indicators hints at how the closures have impacted major metropolises—and how the situation here compares to China, which started reopening a few weeks ago. None of the results are wildly surprising, and all are widely known—not predictive for stocks. But in addition to showing what markets are already digesting, we think they help illustrate why the duration of this shock is likely more important to stocks than the magnitude.
First up, the scourge of every commuter: car traffic congestion. As shown in Exhibit 1, the cities with the worst COVID-19 outbreaks are still far below average. But Wuhan—the virus’s epicenter—is starting to improve a tad, and other major Chinese cities (represented by Shenzhen) have jumped back above average. That augurs well for activity in America and Europe returning to normal once shelter-in-place orders end.
Exhibit 1: Relative Peak Traffic Congestion
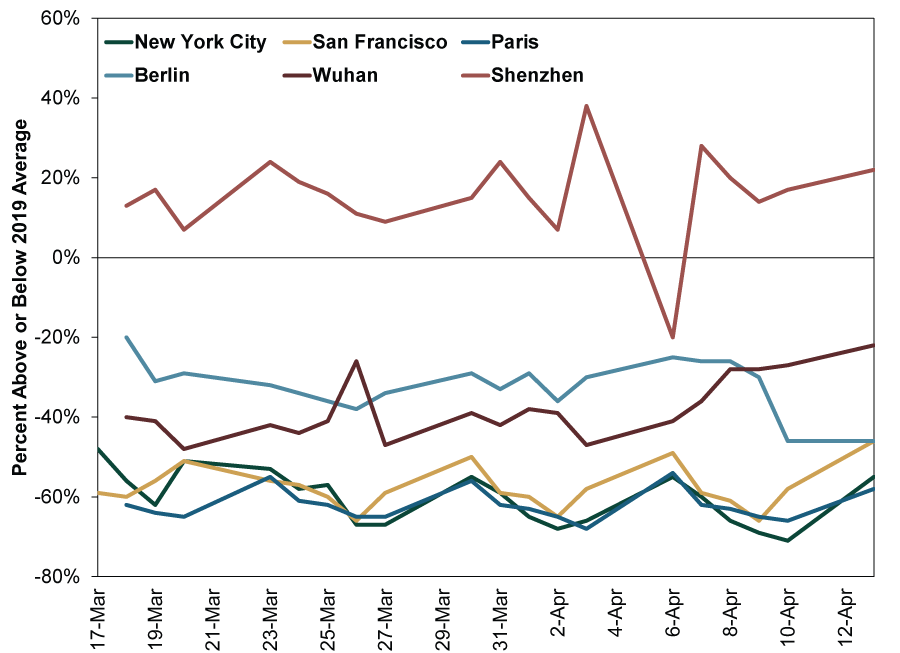
Source: TomTom, as of 4/13/2020. Year-over-year change in daily congestion, 3/17/2020 – 4/13/2020.
Travel and hospitality, unsurprisingly, are suffering, as shown in Exhibits 2 – 4.
Exhibit 2: US Hotel Occupancy

Source: STR, as of 4/13/2020. Weekly occupancy rate, 1/5/2020 – 4/8/2020.
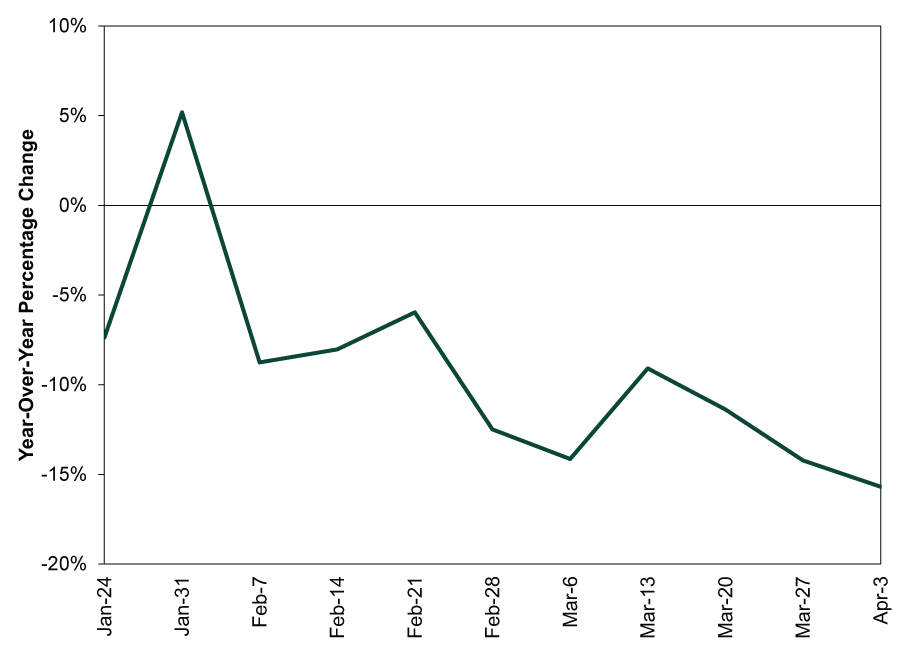
Exhibit 3: Daily TSA US Passenger Volume

Source: TSA, as of 4/13/2020. Year-over-year percentage change in daily passengers, 3/4/2020 – 4/13/2020.
Exhibit 4: Global Air Travel
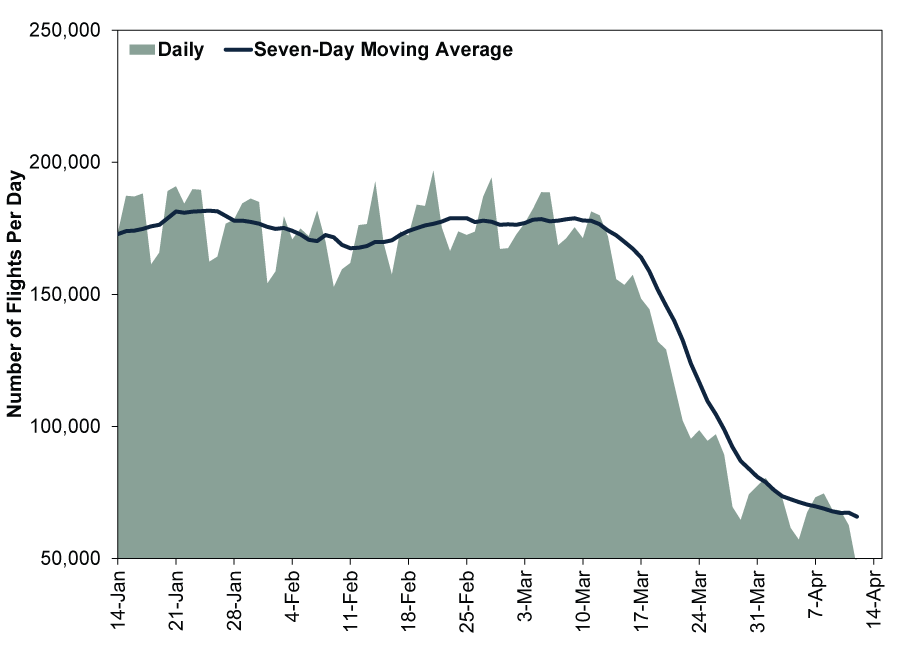
Source: FlightRadar24, as of 4/13/2020. Total number of flights per day, 1/14/2020 – 3/13/2020.
Moving on to general industrial activity, electricity generation and intermodal rail volumes remain down considerably from last year. (Exhibits 5 and 6)
Exhibit 5: US Electricity Generation (Lower 48 States)
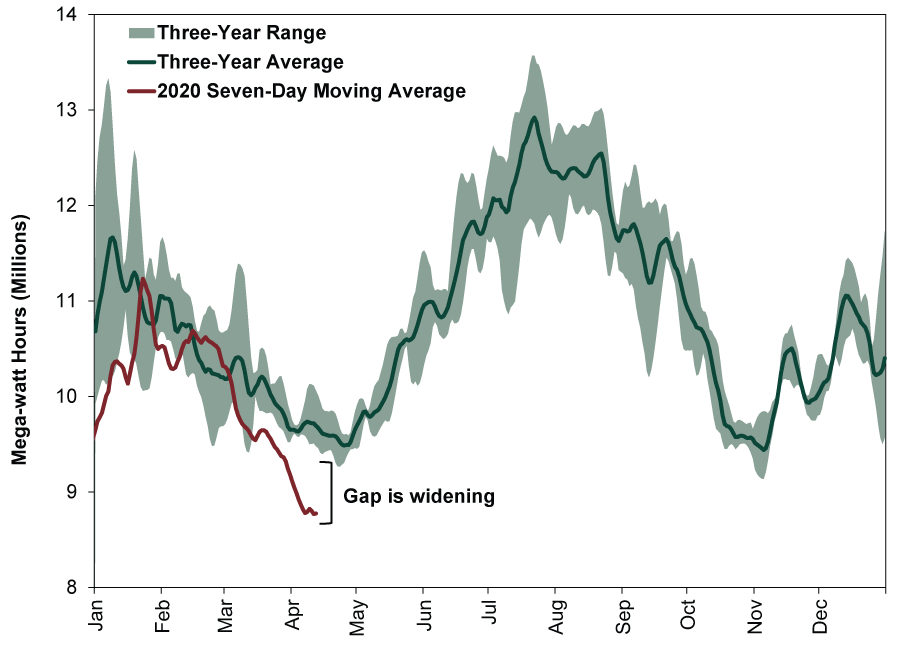
Source: Energy Information Administration, as of 4/13/2020. Daily electricity generation in the lower 48 states, 1/1/2017 – 4/12/2020.
Exhibit 6: US Weekly Intermodal Rail Volumes
Source: Association of American Railroads, as of 4/13/2020. Weekly intermodal rail freight volumes, 1/24/2020 – 4/3/2020.
Lastly, US mortgage applications are down -34% y/y, hitting their lowest level since 2015.
Exhibit 7: Weekly Mortgage Applications
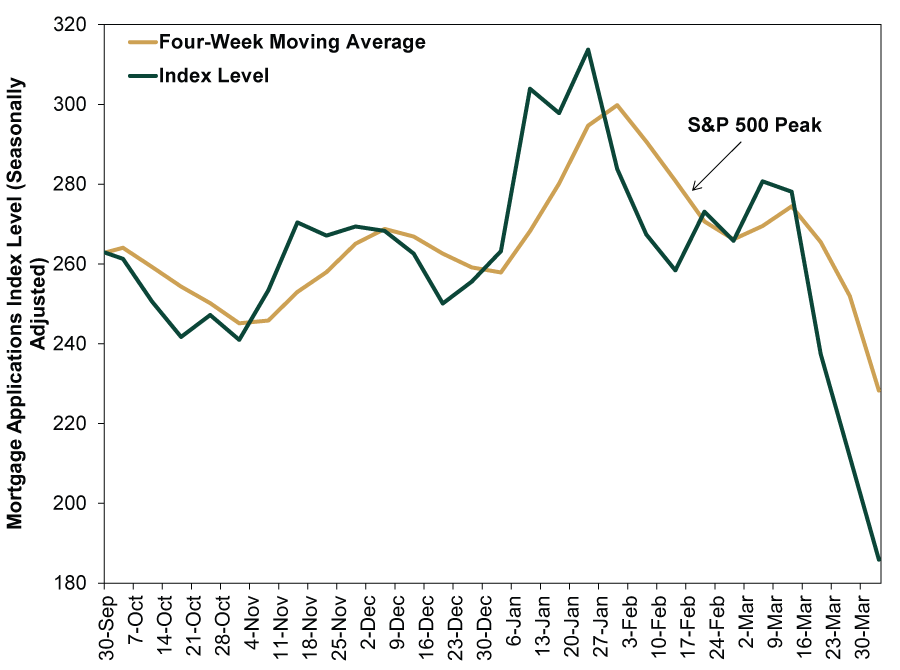
Source: Mortgage Banker Association, as of 4/13/2020. Weekly US mortgage applications, 9/30/2019 – 4/3/2020.
Sum these charts up, and the picture looks clear: a severe economic shock in the Western world—pretty consistent with the severe stock market shock we have been living through. Stocks have done what they normally do, moving ahead of the data and, in this case, resetting prices to reflect a very sharp economic contraction. We aren’t going to try to argue every last bit of bad news is priced in—we can’t know that with any more clarity than whether or not March 23 was this bear’s low. But we do think it is fair to say stocks have focused extremely closely on the near term. All these charts seemingly go hand in hand with a global stock market that plunged -34.0% in just shy of six weeks.[i]
So the real question for stocks, in our view, isn’t how deep the actual economic contraction will be in Q1 or even Q2. But rather: How long will the institutional response to COVID-19 force these measures to remain at catastrophic readings? In our view, that will determine whether stocks have more pain to discount from here, key to when the recovery will occur. Is the market’s rise since March 23 a rational reflection of the economic improvement that should follow if European nations reopen as planned? Is it also accounting for the growing sense an economic reopening in America is drawing near, including new exploratory committees formed in East and West Coast states to develop a timetable? Or is it a bear market rally built on false hopes, with more downside awaiting as closures extend into the summer?
The answer is unknowable now, which is frustrating. But it is what a recovery hinges on, and since it is an unpredictable event, we don’t think it is something investors benefit from trying to time. This isn’t a market-based function that one can assign rational probabilities to. It depends on human analysis and decision-making, not to mention the whims of a new virus that hasn’t yet circulated during the summer, making it harder to gauge its vulnerability to hotter temperatures.
So for retirement and longer-term investors seeking market-like returns over time, we think the best move is to set your expectations accordingly and hang on tight. Short-term disruptions, even the most painful ones, come and go. But stocks generally look 3 – 30 months ahead. Eventually they will shift focus from the short end of that range to the longer end, by which point a vaccine will probably be the talk of the town, enabling a sustained return to normal life and business activity. Even before the data start improving, those visions of a better future than folks can fathom today are all stocks will need for a recovery to get going in earnest—whenever that day might come.
HT: A wide array of Fisher Investments Research Analysts.
[i] Source: FactSet, as of 4/14/2020. MSCI World Index Return with net dividends, 2/12/2020 – 3/23/2020.
If you would like to contact the editors responsible for this article, please message MarketMinder directly.
*The content contained in this article represents only the opinions and viewpoints of the Fisher Investments editorial staff.
Get a weekly roundup of our market insights
Sign up for our weekly e-mail newsletter.

You Imagine Your Future. We Help You Get There.
Are you ready to start your journey to a better financial future?

Where Might the Market Go Next?
Confidently tackle the market’s ups and downs with independent research and analysis that tells you where we think stocks are headed—and why.
Related Resources
-
Expert Commentary Why Ken Fisher Is Optimistic About European Stocks
 2026-07-23
 -
Economics A Summertime Check-in on US Consumers2026-07-23
-
Market Analysis Why the SOX “Bear Market” Isn’t Foreboding2026-07-21
-
Politics Blunting Burnham?2026-07-21


Learn More
Learn why 210,000 clients trust us to manage their money and how Fisher Investments and its affiliates may be able to help you achieve your financial goals.
As of 6/30/2026
New to Fisher? Call Us.
Contact Us Today