Personal Wealth Management / Market Analysis
P/E Ratios and the Case of the Dueling Denominators
The E, not the P, is the driving force behind P/Es these days—and shows why stocks aren’t overvalued.

If you have glimpsed at a financial news site lately, you have probably heard the one about price-to-earnings (P/E) ratios being at their highest level since the Tech Bubble, allegedly signaling stocks are full of hot air and ready to smack investors with a reality check. We have long held the view—backed by a mountain of data—that no level of P/E is inherently good or bad for stocks. While spiking P/Es can indicate euphoria, that is a statement about the rate of change, not the level. Even then, it is important to use the most relevant P/E and look at both halves of the ratio. Today, that analysis shows us stocks aren’t presently overvalued, but also that it is important to keep rational expectations.
Much of the coverage we have encountered focuses on the S&P 500’s trailing P/E ratio—price divided by the last 12 months’ earnings. This figure jumped from 17.06 when stocks bottomed last March 23 to 27.76 on January 8 before inching down a bit. Meanwhile, through yesterday’s close, the S&P 500 had returned a whopping 80.4% since the low. Those factoids are driving the vast majority of the stocks are overvalued chatter. But they are an incomplete look, because they ignore the denominator, earnings. A ratio can rise one of three ways: The numerator can rise, the denominator can fall, or both. The latter is what happened with P/E ratios over the past year. Stocks rose, but S&P 500 earnings per share fell -11.2% last year overall, with drops in all four quarters—and huge falls in Q2 and Q3. That helped pump trailing P/Es.
The problem with using this as a forward-looking indicator is that stocks look ahead, not backward. They aren’t pricing in earnings over the past 12 months. Stocks took care of last year’s earnings drop when they suffered history’s steepest, fastest bear market in February and March 2020. At this point, for stocks, depressed earnings are a heaping load of duh and shouldn’t factor into a forecast, in our view. When you purchase a stock, you are buying a share in its future profits. So what matters from here is whether stocks are overvalued relative to future earnings.
Happily, we also have a P/E for that, and it is more telling about sentiment. The forward P/E ratio divides stock prices by expected earnings over the next year. It isn’t perfect, as estimates are just that. Actual earnings rarely hit estimates—sometimes they miss, and more often, they beat. But the forward P/E is still useful as a measure of sentiment since it shows how investors feel about the future, and a rising forward P/E generally signals more optimism.
This is why we find the S&P 500’s forward P/E rather curious right now. Exhibit 1 shows the S&P 500 total return index and the forward P/E since 2020 began. As you will see, there is an interesting divergence starting in the beginning of June.
Exhibit 1: A Curious Divergence
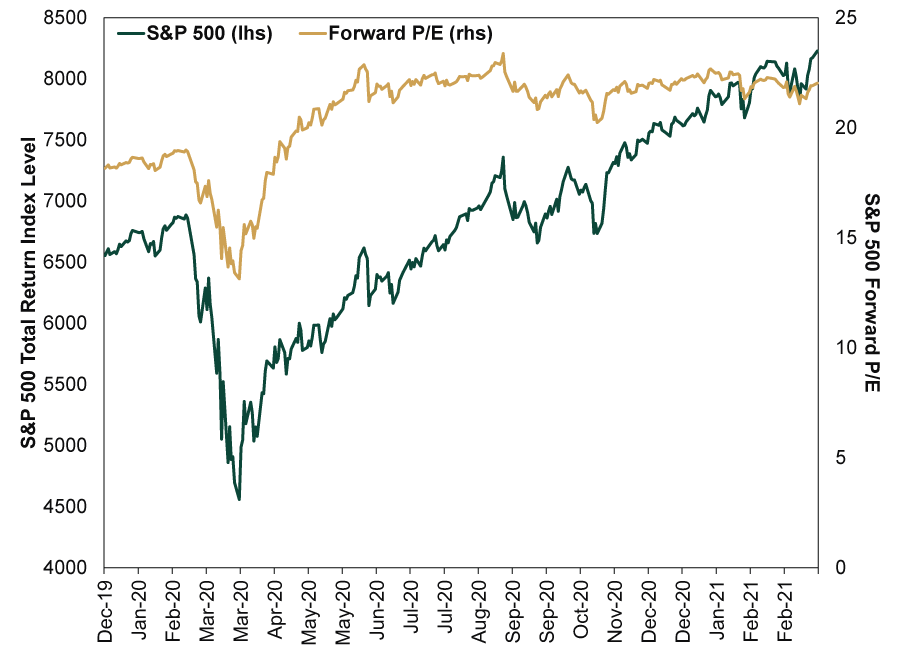
Source: FactSet, as of 3/16/2021. S&P 500 total return index and forward P/E ratio, 12/31/2019 – 3/15/2021.
Over the past 9.5 months, the S&P 500’s forward P/E ratio is basically flat, with minimal volatility. It is elevated relative to history, but three-plus quarters of flatness isn’t a spike. Note, this flat stretch happened as the index returned 32.1%.[i] Going back to our earlier math lesson, if a ratio holds steady while the numerator rises, then the denominator must also be rising. That is the case now: Even as earnings were falling last year, analysts looked to the future, to lockdowns ending and normal(ish) economic activity returning, and penciled in a strong recovery. Stock prices rose alongside expectations, in a sign investors were looking to that same future.
If stocks are rising alongside rational earnings expectations—and not putting an increasingly large premium on those earnings—that signals to us that valuations aren’t running away from reality. But it also sounds an important warning: This year’s pending earnings rebound is probably priced in already. Stocks are probably looking further ahead now, to 2022 and beyond. Hence, what matters is how expectations for that future develop and whether they become too outlandish. We think that will likely be the key factor to watch for as analysts dissect earnings results this year, rather than the actual 2021 results themselves.
Not that we are preaching caution in the here and now. Optimistic sentiment isn’t euphoria, and euphoria on its own isn’t bearish. Rather, the dangerous cocktail is euphoria and deteriorating fundamentals. We aren’t there now, so we think staying bullish is the most beneficial move at the moment. But the sunnier sentiment gets, and the rosier people get about the far future, the likelihood they miss something negative mounts. So keep a watchful eye out even as you enjoy the bull market today.
If you would like to contact the editors responsible for this article, please message MarketMinder directly.
*The content contained in this article represents only the opinions and viewpoints of the Fisher Investments editorial staff.
Get a weekly roundup of our market insights
Sign up for our weekly e-mail newsletter.

You Imagine Your Future. We Help You Get There.
Are you ready to start your journey to a better financial future?

Where Might the Market Go Next?
Confidently tackle the market’s ups and downs with independent research and analysis that tells you where we think stocks are headed—and why.
Related Resources
-
In The News Why Kevin Warsh should think twice about hiking interest rates — even as anxiety over the Iran war grows2026-07-27
-
Expert Commentary 3 Things You Need to Know This Week | Fed Meeting, US Q2 GDP, Eurozone Inflation
 2026-07-27
 -
Weekly Wrap-Up Fisher Investments Reviews: Last Week in Markets — July 20 - July 242026-07-27
-
Politics Takaichi Raises Japan’s Wall of Worry2026-07-27


Learn More
Learn why 210,000 clients trust us to manage their money and how Fisher Investments and its affiliates may be able to help you achieve your financial goals.
As of 6/30/2026
New to Fisher? Call Us.
Contact Us Today