Personal Wealth Management / Economics
Q1 GDP: More Hint Than Revelation
As the BEA stressed, Q1 GDP is mostly an educated guesstimate of COVID-19’s impact, not an airtight calculation.

Q1 US GDP came out Wednesday, giving investors their first glimpse at how well economists have accounted for COVID-19 business disruptions in their projections. In The Wall Street Journal’s most recent survey, estimates ranged from 1.5% annualized growth to an -8.1% contraction. The actual result: a -4.8% annualized decline. That is in the mid-low end of the range and below the general consensus’s average. However, due to the way the Commerce Department’s statisticians calculate the preliminary GDP estimate, it still doesn’t provide a great look at how much social distancing restrictions have hit economic activity. So our advice for investors is: Don’t draw firm conclusions, for better or worse, and remember stocks look forward.
Exhibit 1 shows a more detailed breakdown of GDP’s major components. Note, all of the figures here are seasonally adjusted annualized growth rates. So not only are they manipulated a bit to smooth out seasonal skew (e.g., holidays and weather), but they show the rate GDP would grow or contract in the full year if the quarterly growth rate persisted. In other words, GDP did not shrink by nearly 5% in one quarter. The quarter-over-quarter contraction rate was -1.2%.[i] We point this out because European nations, which will soon begin reporting, use the quarter-over-quarter numbers. So to compare them to the US’s result, you will have to compound them by converting them to decimals (i.e., 1.2% becomes 0.012), adding one, taking them to the fourth power, and then subtracting one.[ii] And here endeth the math detour.
Exhibit 1: GDP and Its Main Components
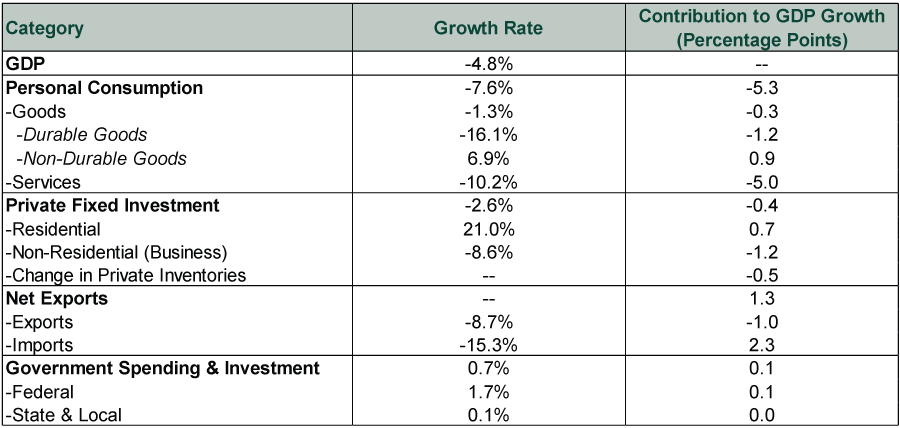
Source: Bureau of Economic Analysis, as of 4/29/2020. All figures are seasonally adjusted annualized rates. Figures may not sum due to rounding.
Nothing here is terribly surprising. Consumer spending was always going to tank, considering most shops and personal service providers (e.g., hair salons and dental offices) were closed. But spending on non-durable goods—which includes food and toilet paper—logically rose as people stockpiled for shelter-in-place. Imports and exports both plunged, but since GDP math subtracts imports—which are much larger than exports—net trade contributed positively. The one potentially weird development is the surge in real estate investment, but we suspect that has something to do with a blitz in home buying in the weeks between mortgage rates’ plunge to record lows and the advent of shelter-in-place.
Frustrating as it might be, even this report doesn’t give us a great look at COVID-19’s impact. Most restrictions phased in throughout March, so only one month was severely affected. That month also happens to be the one for which statisticians have incomplete data. The preliminary GDP estimate is always based partly on modeling. That was especially difficult this time due to COVID-19. For those who enjoy economic detail, here is a link to the report’s accompanying “Technical Note,” which explains which data they did and didn’t have and how they attempted to make up for the latter. In short, they gathered all the data they could, crunched a lot of numbers, and made the most educated guess they could. As more data emerge over the next several weeks, the BEA will revise this figure at least twice more, giving us an increasingly refined look.
Yet even then, one can’t simply look at the revised estimate and say “aha, so that’s how badly business closures hurt.” Simply, it is mathematically impossible to calculate COVID-19’s affect. As the BEA explained: “The full economic effects of the COVID-19 pandemic cannot be quantified in the GDP estimate for the first quarter of 2020 because the impacts are generally embedded in source data and cannot be separately identified.” The Fed and various Commerce Department agencies that compile data can show us how much manufacturing output, durable goods orders, retail sales and everything else fell. But they can’t isolate COVID-19 as a variable because there is no counterfactual—no “excluding COVID-19” dataset to compare the results to. All we know is that most data pointed to growth in the year’s first two months, before the shelter-in-place orders took effect.
Q2 is already shaping up to be similarly fuzzy. With most of the country locked down in April, we know Q2 probably started off a lot worse. Some states are starting to reopen, so May could see some stabilization. But California remains shut indefinitely, and the Bay Area’s shelter-in-place order just got extended through May 31. Upstate New York will start trickling back to work in mid-May, but Manhattan will almost certainly stay offline longer. These areas account for a large chunk of GDP. Modeling the whole nation will require digging into state- and county-level contributions and cross-referencing those with local policies. So, consider this your advance warning for Q2 GDP forecasts to be all over the map—and awful.
The silver lining to all this: Markets are a leading economic indicator. They are very good at pricing in developments in real-time, before those developments show up in the data. The market is the accumulated knowledge, opinions and wisdom of every investor on Earth. Its collective intuition can identify trends that economists’ models struggle with. Stocks also tend to look further into the future. While number-crunchers have dwelled on data and forecasts, stocks may have started digesting a forthcoming gradual reopening over the next several months. What matters from here is how those expectations evolve and whether or not they are too optimistic. We can’t know that now. But if Q1 GDP helps reduce expectations, so much the better, as that lowers the bar for reality to clear eventually.
[i] Source: FactSet, as of 4/29/2020.
[ii] And add the negative sign back to them, as multiplying a negative by a negative creates a positive number. This note is solely to let you know that we are as nitpicky about math as you are.
If you would like to contact the editors responsible for this article, please message MarketMinder directly.
*The content contained in this article represents only the opinions and viewpoints of the Fisher Investments editorial staff.
Get a weekly roundup of our market insights
Sign up for our weekly e-mail newsletter.

You Imagine Your Future. We Help You Get There.
Are you ready to start your journey to a better financial future?

Where Might the Market Go Next?
Confidently tackle the market’s ups and downs with independent research and analysis that tells you where we think stocks are headed—and why.
Related Resources
-
Market Analysis Why the SOX “Bear Market” Isn’t Foreboding2026-07-21
-
Politics Blunting Burnham?2026-07-21
-
Expert Commentary 3 Things You Need to Know This Week | Q2 Earnings, ECB Meeting, Trump Accounts
 2026-07-20
 -
Weekly Wrap-Up Fisher Investments Reviews: Last Week in Markets—July 13 - July 172026-07-20


Learn More
Learn why 210,000 clients trust us to manage their money and how Fisher Investments and its affiliates may be able to help you achieve your financial goals.
As of 6/30/2026
New to Fisher? Call Us.
Contact Us Today