Personal Wealth Management / Economics
Seeing Through LEI’s Shale Skew
In our view, the US Leading Economic Index’s mild slide isn’t as ominous as it may seem.

Is a reliable recession indicator flashing red? The Conference Board’s US Leading Economic Index fell -0.1% m/m in October, its third straight drop.[i] Moreover, the six-month change—how The Conference Board identifies trends—flipped negative in October for the first time this year. Given a lengthy LEI decline has preceded every US recession since 1959, this rough stretch may look discouraging. But in our view, it primarily reflects US manufacturing’s—and specifically the shale oil industry’s—ongoing troubles. This bull market has withstood both already, and we expect the same this time.
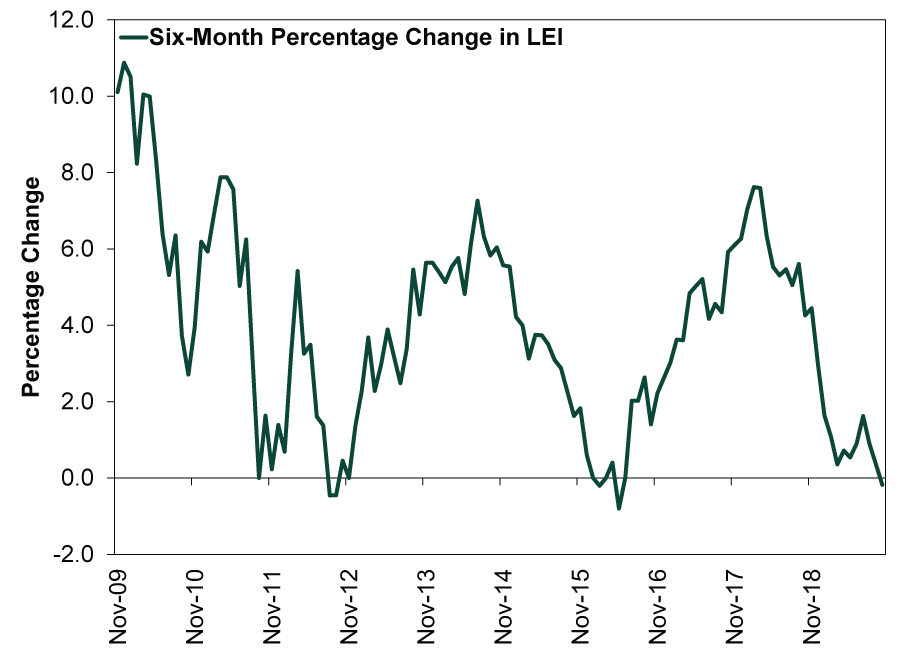
First, a word on LEI’s relevance for investors. It can’t predict stocks, since they are one of its components—stocks don’t predict stocks. But by (generally) previewing the economy’s next several months, LEI can help you gauge whether expectations are too high or too low—key to assessing the stock market’s outlook. However, analyzing this isn’t as simple as comparing LEI’s trend to broad recession expectations. Not every LEI decline is a recession harbinger. There are false signals, as Exhibit 1 shows by plotting the US LEI’s 6-month percentage change over the last 10 years.
Exhibit 1: LEI’s False Signals
Source: FactSet, as of 11/25/2019. Six-month percentage change in LEI, November 2009 – October 2019.
Hence, you must dig into why LEI fell before drawing broad conclusions. Assessing its components is a good place to start. Exhibit 2 shows each component’s contributions to the LEI’s month-over-month percentage change. Last autumn, stocks’ correction and rising jobless claims weighed most. But recent LEI dips’ key driver is manufacturing weakness.
Exhibit 2: LEI, Deconstructed
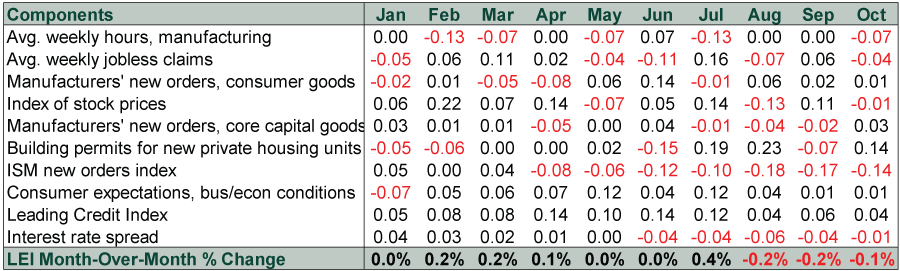
Source: FactSet, as of 11/26/2019. LEI components’ contributions, October 2018 – October 2019. Note: Sum of contributions will not always equal monthly percentage change due to rounding and base value differences. Core capital goods orders are orders for non-defense capital goods excluding aircraft.
Manufacturing’s ability to pull the index negative is partly a function of LEI’s design. Four of its components track the manufacturing sector, combining for a 56.2% weighting. Manufacturing, meanwhile, comprises 11.4% of US GDP.[ii] ISM’s manufacturing new orders have detracted for seven months straight.[iii] Core capital goods orders and hours worked by employees of manufacturing firms have also weighed. This suggests the global manufacturing slowdown is still part of the backdrop. But US shale firms’ struggles are also weighing on manufacturing recently, likely skewing LEI downward.
From mid-2016 to mid-2018, shale firms invested in scads of new projects, aiming to maximize production and gain market share. This frequently meant operating at a loss and taking on significant debt. Now many are under pressure from creditors to clean up balance sheets and improve profitability. As a result, firms aren’t drilling many wells. Baker Hughes’ tally of US active oil rigs fell from a recent high of 888 last November to 671 in the week ending 11/22/2019—a -24% reduction.[iv] Efficiency gains (e.g., automation and improved drilling techniques) also reduce the need for equipment. Hence, shale firms’ spending has sagged. In Q3, energy investment—which hasn’t risen since Q2 2018—fell -29.3% annualized.[v]
These forces show up in LEI via falling new orders (both ISM’s and core capital goods) and average weekly manufacturing hours worked. This recalls 2015 – 2016, when energy-related investment plummeted between -30% and -70% annualized for 6 straight quarters (Q1 2015 – Q2 2016).[vi] LEI flattened and turned negative on a six-month basis (see Exhibit 1), and ISM new orders detracted for almost two years.[vii]
While the pain probably isn’t over yet, shale’s current rough patch may not last as long or take as big a toll on GDP as the prior one. WTI crude oil plunged from $100+ per barrel in mid-2014 to $26/barrel in February 2016.[viii] In a price-sensitive industry, this was catastrophic for many firms. Between Q3 2015 and Q2 2016, 82 oil and gas producers declared bankruptcy.[ix] Rigs in operation fell more than -80% between October 2014 and May 2016, bottoming out at 316.[x]
The recent decline in drilling activity pales in comparison, at least thus far. The pace of reduction is also far slower. During the 2014 – 2016 slide, drillers mothballed an average of 15 rigs per week versus 4 per week since November 2018.[xi] Higher oil prices are likely one reason why. Rather than plumbing new lows, WTI crude’s price is $57.98 as of November 26—28% above where it started the year, though down -12% since April 23’s year-to-date high.[xii] With supply and demand roughly balanced, prices likely remain range-bound. This lowers the probability of another bout of plunging prices battering oil drillers’ profits. Accordingly, small driller bankruptcies are up this year, but they aren’t near 2015 – 2016 levels.[xiii]
Another factor helping drillers: Technological advances have slashed the breakeven price for new wells. A March survey by the Dallas Fed put it at around $50/barrel, down from about $75/barrel in 2014.[xiv] Operating existing wells profitably required prices around just $30 – $35.[xv] This likely helps some producers stay in better fiscal shape at today’s oil prices, though breakeven prices vary dramatically based on locale. Small drillers in higher-cost areas could easily feel a pinch.
Even if shale’s woes escalate, we don’t think a recession or bear market would follow. Neither struck in 2015 – 2016—perhaps because energy-related investment is just 3.8% of business investment and 0.5% of GDP.[xvi] Also, just like today, the industry’s troubles were widely covered, sapping surprise power. Hence, we don’t think an LEI soft patch fueled by well-known headwinds in a corner of the US economy that likely lacks the heft to derail the expansion is reason to shun stocks. The bull market weathered the last such period, and we don’t see compelling evidence this time will be different.
[i] Source, The Conference Board, as of 11/25/2019.
[ii] Source: FactSet, as of 11/25/2019. Manufacturing output as a percentage of GDP, Q2 2019.
[iii] ISM’s Manufacturing New Orders Purchasing Managers’ Index actually signaled expansion for three of those months. But since LEI compares each reading to the series’ historical average, it subtracted here.
[iv] Source: Baker Hughes, as of 11/25/2019. US oil rig count in the weeks ending November 16, 2018 and November 22, 2019.
[v] Source: Bureau of Economic Analysis, as of 11/25/2019.
[vi] Ibid.
[vii] Source: FactSet, as of 11/25/2019.
[viii] Source: FactSet, as of 11/26/2019. WTI crude oil price, 6/16/2014 – 2/11/2016.
[ix] “Oil and Gas Bankruptcies Grow as Investors Lose Appetite for Shale,” Rebecca Elliott and Christopher M. Matthews, The Wall Street Journal, 8/30/2019. https://www.wsj.com/articles/oil-and-gas-bankruptcies-grow-as-investors-lose-appetite-for-shale-11567157401
[x] Source: Baker Hughes, as of 11/25/2019. US oil rig count, October 2014 and May 2016.
[xi] Ibid.
[xii] Source: FactSet, as of 11/26/2019.
[xiii] “Oil and Gas Bankruptcies Grow as Investors Lose Appetite for Shale,” Rebecca Elliott and Christopher M. Matthews, The Wall Street Journal, 8/30/2019. https://www.wsj.com/articles/oil-and-gas-bankruptcies-grow-as-investors-lose-appetite-for-shale-11567157401
[xiv] “Dallas Fed: Shale gains bring U.S. oil breakeven price down to $50 a barrel,” Jordan Blum, Houston Chronicle, 5/21/2019. https://www.chron.com/business/energy/article/Dallas-Fed-Shale-gains-bring-U-S-oil-breakeven-13866348.php
[xv] “Energy Slideshow,” Federal Reserve Bank of Dallas, updated 11/4/2019. https://www.dallasfed.org/-/media/Documents/research/energy/energycharts.pdf?la=en
[xvi] Source: Bureau of Economic Analysis, as of 11/25/2019. Private fixed investment in mining, exploration, shafts and wells as a percentage of nonresidential private fixed investment and as a percentage of GDP in Q3 2019.
If you would like to contact the editors responsible for this article, please message MarketMinder directly.
*The content contained in this article represents only the opinions and viewpoints of the Fisher Investments editorial staff.
Get a weekly roundup of our market insights
Sign up for our weekly e-mail newsletter.

You Imagine Your Future. We Help You Get There.
Are you ready to start your journey to a better financial future?

Where Might the Market Go Next?
Confidently tackle the market’s ups and downs with independent research and analysis that tells you where we think stocks are headed—and why.
Related Resources
-
Market Analysis The New Tariffs in Town Are Still Old News2026-07-24
-
Expert Commentary This Week in Review | Market Volatility, Tariffs, SpaceX
 2026-07-24
 -
Economics A Summertime Check-in on US Consumers2026-07-23
-
Expert Commentary Why Ken Fisher Is Optimistic About European Stocks
 2026-07-23


Learn More
Learn why 210,000 clients trust us to manage their money and how Fisher Investments and its affiliates may be able to help you achieve your financial goals.
As of 6/30/2026
New to Fisher? Call Us.
Contact Us Today