Personal Wealth Management / Market Analysis
Sentiment Check-In: Correction Edition
Sentiment looks awfully correction-like.

We are now more than three months past stocks’ last high, and folks are getting antsy. Earlier in the correction, when stocks staged a partial rebound from February 8’s low, investors and pundits alike seemed cheerful. Volatility over, big mistakes averted, job-well-done—that was the going mentality in most commentary we read in late February and early March. That was one reason we thought it would be wise to warn our dear readers that more pain might be in store—corrections often don’t end until more investors capitulate, and we hadn’t seen that mentality yet. Now, however, the sentiment landscape has changed. The S&P 500’s sideways shuffle has people feeling down. Headlines argue this bull market is out of positive catalysts. We still don’t think it is possible to know whether we have seen the correction’s ultimate low point—nor can anyone know when a recovery will take off in earnest. Short-term timing is impossible. But markets frequently do what few expect, and most sentiment indicators suggest very few investors expect stocks to do well for the foreseeable future. Hence, at some point, we believe this bull market should resume its upward course with gusto.
Exhibits 1 through 4 show the evolution in some sentiment gauges since the correction began in late January. Equity fund flows—one measure of retail investors’ appetite for risk-taking—have now been negative for three months. Forward P/E ratios for the S&P 500 and MSCI World Index have fallen back in line with five-year averages, implying less desire to pay up for stocks’ future earnings. The Investors Intelligence survey shows the percentage of bullish US investors is dwindling.
Exhibit 1: Total Equity Fund Flows (Mutual Funds + ETFs)
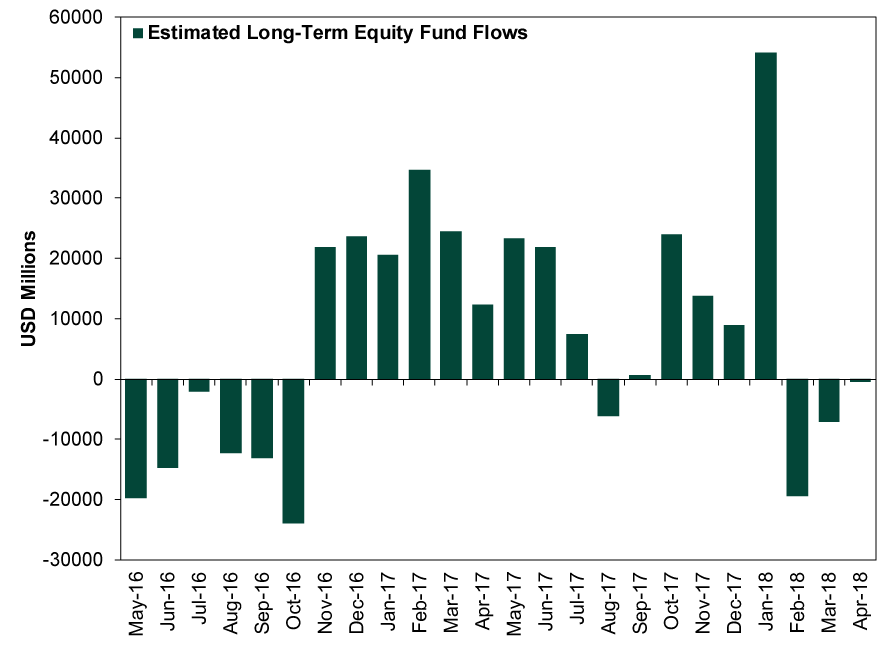
Source: FactSet, as of 5/3/2018. April 2018 total based on the sum of weekly net inflows during the month. All others use the officially reported monthly total.
Exhibit 2: S&P 500 12-Month Forward P/E Ratio During This Bull Market
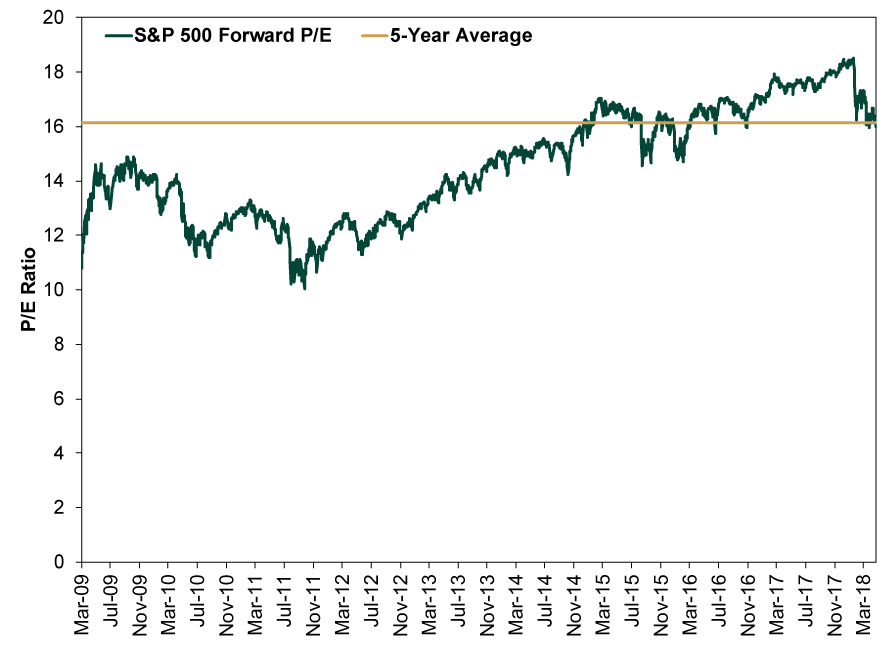
Source: FactSet, as of 5/3/2018. Daily S&P 500 Forward P/E, 3/9/2009 – 5/2/2018.
Exhibit 3: MSCI World Index 12-Month Forward P/E Ratio During This Bull Market
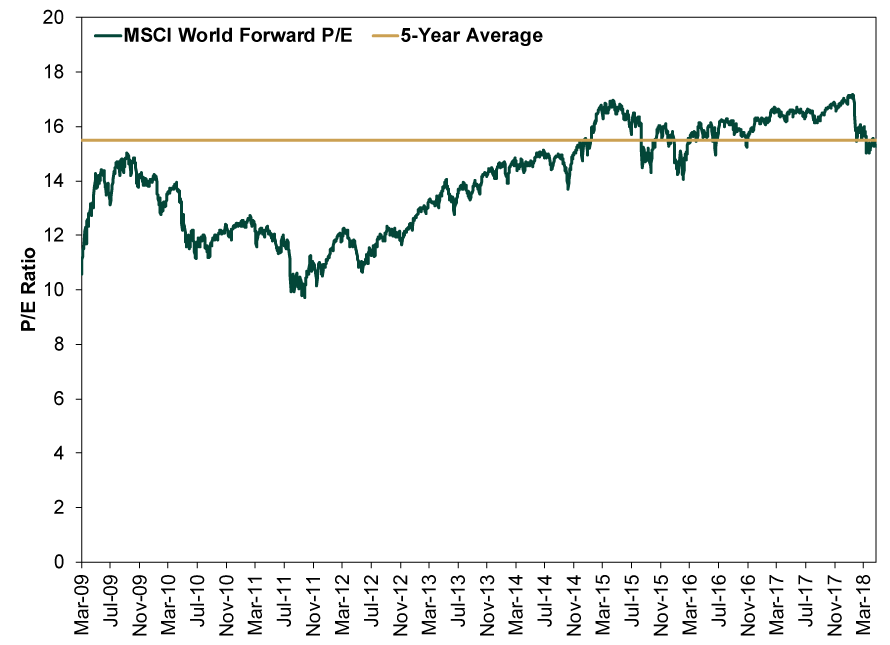
Source: FactSet, as of 5/3/2018. Daily MSCI World Forward P/E, 3/9/2009 – 5/2/2018.
Exhibit 4: Investor Intelligence Sentiment Survey
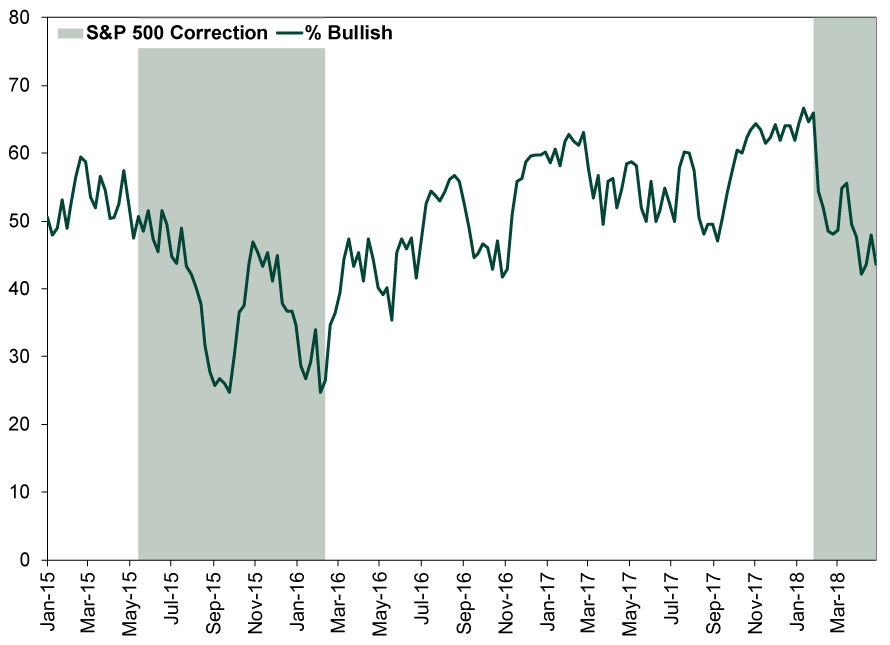
Source: FactSet, as of 5/3/2018.
Beyond these, other metrics show investors’ mood souring. Germany’s April ZEW investor confidence index sank to its lowest level since late-2012—the throes of the eurozone crisis. The Conference Board’s gauge of US investor sentiment showed just 33% of respondents thought stocks will rise over the next 12 months in April—down from 51% in January. In the American Association of Individual Investors’ latest survey, 28.4% of respondents said they are bullish—down from 59.8% on January 4.
One especially encouraging thing about this: Usually, as a bear market unfolds, sentiment doesn’t fall along with stocks. Because bear markets start gently, usually when investors are irrationally optimistic about the future, confidence stays strong as folks offer up reasons stocks should have a quick recovery. For the past couple months, we have seen the opposite: People broadly looking for causes for the volatility and extrapolating what they find into further weakness. First, it happened with US wage growth and inflation. Then tariffs. Then inflation again, as people read too much into 10-year Treasury yields’ flirtation with 3%. This week, folks are preoccupied with allegedly peaking earnings and, having decided the tax cuts’ mojo is spent, fear this bull market is out of positive catalysts.
Now, sentiment on its own isn’t predictive. But sentiment falling relative to fundamentals implies stocks have more of the bull market’s proverbial “wall of worry” left to climb. While sentiment has sunk and stocks have drifted, economic fundamentals haven’t gotten radically worse. Yield curves globally are still moderately steep. Money supply and lending are growing at decent rates across most major economies—fuel for future investment and commerce. The latest round of purchasing managers’ indexes, though showing slower growth across the board, show forward-looking new orders growing in America, the UK and throughout Continental Europe. The Conference Board’s Leading Economic Indexes (LEIs) are mostly trending higher—except for the UK, where the sentiment-related components are dragging on the composite (fundamental components in that LEI are rising). Again, usually in a bear market, you see the opposite: firm confidence contrasting with broad negativity in leading indicators.
This is a big reason that, despite stocks’ apparent hesitancy to bounce back today, we don’t think a bear market began in January. It looked like a sentiment-related swing from the start—and looks even more so now, with investors an overall sadder bunch today than three months ago. It is impossible to say when the tide will turn, but we do believe it will. So don’t let the world’s mounting skepticism suck you in. Patience is still the watchword.
If you would like to contact the editors responsible for this article, please message MarketMinder directly.
*The content contained in this article represents only the opinions and viewpoints of the Fisher Investments editorial staff.
Get a weekly roundup of our market insights
Sign up for our weekly e-mail newsletter.

You Imagine Your Future. We Help You Get There.
Are you ready to start your journey to a better financial future?

Where Might the Market Go Next?
Confidently tackle the market’s ups and downs with independent research and analysis that tells you where we think stocks are headed—and why.
Related Resources
-
Market Analysis The New Tariffs in Town Are Still Old News2026-07-24
-
Expert Commentary This Week in Review | Market Volatility, Tariffs, SpaceX
 2026-07-24
 -
Expert Commentary Why Ken Fisher Is Optimistic About European Stocks
 2026-07-23
 -
Economics A Summertime Check-in on US Consumers2026-07-23


Learn More
Learn why 210,000 clients trust us to manage their money and how Fisher Investments and its affiliates may be able to help you achieve your financial goals.
As of 6/30/2026
New to Fisher? Call Us.
Contact Us Today