Personal Wealth Management / Market Volatility
Stocks Complete the Quick Round Trip to All-Time Highs
And we celebrate with two timeless lessons.

The S&P 500 and global stocks have fully erased September’s pullback as of Tuesday’s close, returning to all-time highs.[i] By recovering so quickly, stocks have once again taught two timeless lessons. Let us discuss.
1. Volatility goes both ways.
People often use volatility and negativity synonymously, and we will cop to falling into that trap now and then. But volatility really means movement, up and down. High volatility means the market’s movements are bigger—bigger up and bigger down. Usually, the bigger up and bigger down come hand in hand, which is why stocks often recover swiftly from pullbacks and their big brothers, corrections (sharp, sentiment-fueled drops of -10% to -20%).
So it went this time. The S&P 500 peaked on September 2, with the MSCI World following on September 6. The former troughed 21 trading days later, on October 4—a -5.1% decline.[ii] Yet the return to breakeven took just 12 trading days. The latter took a similar trip—down -5.5% through October 4, recouping the drop in 16 trading days. Fast down, followed by fast up. That happens to be the S&P 500’s sixth-largest 12-day stretch of 2021, by the way. The five that beat it also followed brief pullbacks. One, the 5.9% jump between January 29 and February 17, happened in the first 12 trading days after a -3.6% drop from January 25 to January 29.[iii] The other four happened in April, during the big rally that followed a -4.1% pullback between February 12 and March 4.[iv]
Those facts are mostly trivia, but they do illustrate why we counsel against trying to time the market’s wiggles. During bull markets, the good bursts and the bad bursts often happen in quick succession. If you run at the first sign of trouble, you could very well miss the good burst that follows, rendering the whole endeavor counterproductive.
Exhibit 1 illustrates this in borderline comical fashion, clocking the number of trading days each leg of this year’s S&P 500 pullbacks lasted. In all but one case, stocks rose faster than they fell.
Exhibit 1: Stocks Turn on a Dime
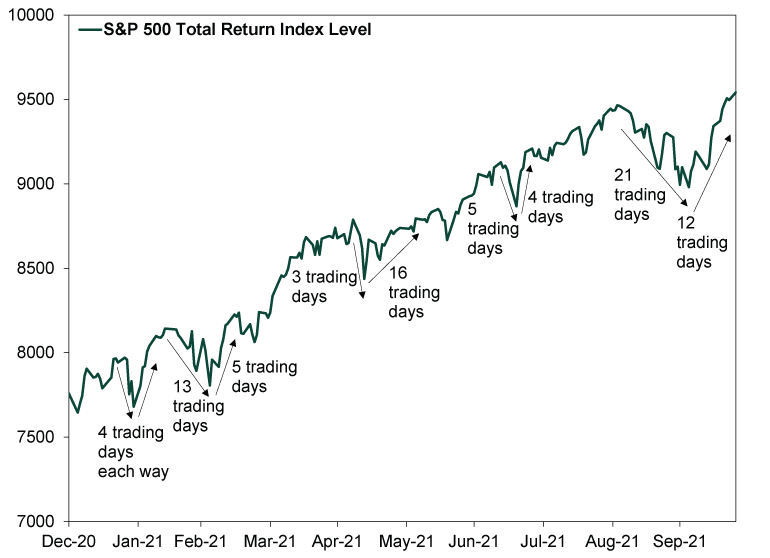
Source: FactSet, as of 10/26/2021. S&P 500 Total Return Index, 12/31/2020 – 10/25/2021.
If you are wondering, we called this comical because the pullbacks are so frequent, it seems absurd to highlight them. We promise we aren’t trying to feed your myopia! Rather, the opposite: If stocks endure so many wiggles en route to 23.0% year-to-date returns as of Monday’s close, then there is little point in sweating them.[v] They are part and parcel of stocks’ wonderful bull market returns, in our view.
2. Stocks often bounce while the news is still bad.
Tying volatility to any one issue is often a fool’s errand, but pullbacks and corrections often feature what we call ghost stories, making it fitting that this one happened as we were all setting out our Halloween decorations and stocking up on candy. In general, ghost stories start with a grain of truth—some negative development—but take it far beyond reality, to a place where expectations get irrationally low. That helps stocks price the negativity relatively quickly, enabling them to move on before the issues resolve. After all, stocks don’t need perfection—better than expected generally suffices.
Befitting the Halloween season, this autumn’s pullback had three ghost stories: the global supply chain mayhem, Europe and China’s energy shortages, and the potential default of China Evergrande. All three present some modest near-term economic headwinds, and all are still playing out. Container ships are still idling for weeks outside major ports globally, waiting for their turn to dock. Several shelves at our local markets are empty. Europe’s benchmark natural gas prices have fallen a bit from early October’s peak, but they remain over 450% above their 2021 low in early March.[vi] As of mid-October, China was still reportedly enduring localized power cuts. As for Evergrande, it avoided default for now by making its first missed bond payment before the 30-day grace period expired last Friday, but another deadline looms on October 29. Meanwhile, other smaller, distressed property developers have missed payments too, including one on Monday. An orderly collapse of Evergrande and a broader shakeout of troubled firms still seems likely.
Yet it also seems to be dawning gradually on folks that none of these supposed monsters has teeth. IHS Markit’s flash manufacturing purchasing managers’ indexes, which hit the wires last Friday, showed growth in US and European factories remained widespread despite the supply issues. European wind power generation has picked up. Natural gas producers in the US and Canada are ramping up output to help satisfy high global demand. China is reopening coal mines and even reportedly resumed using Australian coal, perhaps signaling the end of its implicit ban. And while some Chinese developers will fail, the People’s Bank of China is pumping liquidity to healthier companies, helping stabilize the property sector overall. Perfection? Of course not—there is no such thing. Maybe it doesn’t even rate as good news. But better than what people feared a month ago? Sure seems that way to us.
Merging our two lessons into one, stocks never sound an all clear. If you wait for the ghost stories’ conclusion when Scooby Doo and those pesky meddling kids pull off the mask revealing the ne’er-do-well beneath,[vii] you will probably also miss the aforementioned fast rebounds. This is perhaps the hardest part of investing—the need to stay disciplined through speedbumps and bad news. But the reward is reaping stocks’ long-term returns, and if you need those returns to reach your long-term goals, then that patience is vital to your financial future.
[i] Source: FactSet, as of 10/26/2021. Statement based on level of S&P 500 Total Return and MSCI World Index with net dividends.
[ii] Source: FactSet, as of 10/26/2021. S&P 500 total return, 9/2/2021 – 10/4/2021.
[iii] Ibid. S&P 500 total return, 1/29/2021 – 2/17/2021 and 1/25/2021 – 1/29/2021.
[iv] Ibid. S&P 500 total return, 2/12/2021 – 3/4/2021.
[v] Ibid. S&P 500 total return, 12/31/2020 – 10/25/2021.
[vi] Ibid. Dutch TTF Gas Price, 3/3/2021 – 10/26/2021.
[vii] Yes, this is a reference to the old cartoon.
If you would like to contact the editors responsible for this article, please message MarketMinder directly.
*The content contained in this article represents only the opinions and viewpoints of the Fisher Investments editorial staff.
Get a weekly roundup of our market insights
Sign up for our weekly e-mail newsletter.

You Imagine Your Future. We Help You Get There.
Are you ready to start your journey to a better financial future?

Where Might the Market Go Next?
Confidently tackle the market’s ups and downs with independent research and analysis that tells you where we think stocks are headed—and why.
Related Resources
-
Market Analysis The New Tariffs in Town Are Still Old News2026-07-24
-
Expert Commentary This Week in Review | Market Volatility, Tariffs, SpaceX
 2026-07-24
 -
Economics A Summertime Check-in on US Consumers2026-07-23
-
Expert Commentary Why Ken Fisher Is Optimistic About European Stocks
 2026-07-23


Learn More
Learn why 210,000 clients trust us to manage their money and how Fisher Investments and its affiliates may be able to help you achieve your financial goals.
As of 6/30/2026
New to Fisher? Call Us.
Contact Us Today