Personal Wealth Management / Market Analysis
Stocks for the Long Run?
While stocks’ trailing bonds over long stretches is unusual, it isn’t unprecedented—or a sign stocks can’t meet investors’ long-term growth needs anymore.

US Treasury yields have plunged this year, lifting most bond prices during stocks’ bear market. One byproduct: Various bonds’ total returns now outpace US stocks’ since 2000’s start. For example, 10-year Treasurys have returned 213.7% compared to the S&P 500’s 187.1%.[i] We have noticed some news commentators seizing on this, arguing it means stocks no longer compensate investors for their higher volatility via higher returns. In our view, though, bonds’ outperformance over the last two decades doesn’t alter stocks’ superiority for investors needing long-term growth.
It seems popular among articles touting bonds’ 20-year edge to note that long-term US government bonds have outperformed in 26% of 20-year rolling periods ending in 2000 or later.[ii] This is a fair point to a limited extent, but we see a problem: It uses monthly rolling periods. Since bonds’ historical stretches of outperformance tend to cluster around bear markets, any figure using monthly rolling calculations could easily be double counting (or more)—overstating the phenomenon’s frequency. We think it is clearer to use rolling annual returns, which better isolate bonds’ leadership stretches.
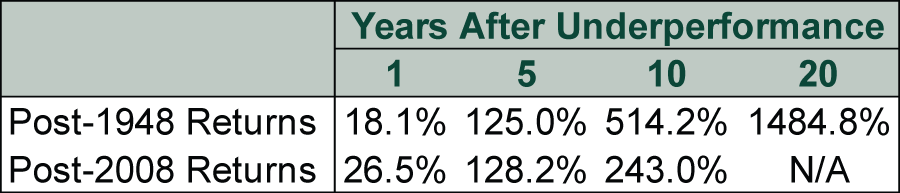
On that basis, there have been two previous annual 20-year stretches of 10-year Treasury outperformance—1929 – 1948 and 1989 – 2008.[iii] As Exhibit 1 highlights, neither prevented big subsequent stock market gains. In the latter case, the most recent bull market—history’s longest—kicked off the following year. Investors who concluded stocks’ historically higher returns wouldn’t resume might have missed out. Cumulative US stock returns have also far outpaced 10-year Treasurys from 2009 onwards, current bear market included—299.4% to 52.2%.[iv]
Exhibit 1: US Stocks’ Big Gains After 20-Year Stretches of Trailing Bonds
Source: Global Financial Data, as of 5/5/2020. S&P 500 Total Return Index, 12/31/1948 – 12/31/1968 and 12/31/2008 – 12/31/2018. Cumulative returns over the periods shown.
This doesn’t mean stock returns in the coming years will necessarily look like the above. But it does highlight how timing influences rolling returns. US stocks endured bear markets near the start and end of both previous stretches of bond outperformance. Likewise, the 20-year period that inspired pundits’ current take began in April 2000—just after the dot-com bubble popped—and ends in 2020’s downturn. In our view, this shows how timing quirks—not fundamental shifts in the relationship between stocks and bonds—best explain the rare cases of 20-year bond outperformance.
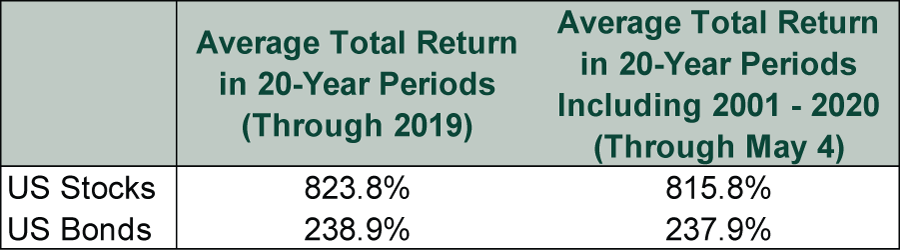
Moreover, even in the two other annual 20-year periods when bonds outperformed, it was by only a little—90.9% to 74.1% in 1929 – 1948 and 423.4% to 404.3% from 1989 – 2008.[v] Meanwhile, as Exhibit 2 shows, stocks’ cumulative returns over all annual 20-year periods (which include bear markets and lagging stretches versus bonds) are far higher than 10-year Treasury bonds’ on average—even when treating stocks’ year-to-date drop as 2020’s full-year return. The reason: Bull markets follow bear markets, and stocks usually clock dozens or more all-time highs between bear markets.
Exhibit 2: US Stocks’ Long-Term Returns Easily Outpace Bonds
Source: Global Financial Data, as of 5/5/2020. 20-year rolling average annual returns for the USA 10-Year Government Bond Total Return Index and the S&P 500 Total Return Index, 12/31/1925 – 12/31/2019 and cumulative returns for both indexes, 12/31/2019 – 5/4/2020.
For investors needing long-term growth, we think the totality of this history should matter more than three contrary data points. Past performance isn’t predictive, but the full history shows the probability of superior returns is much higher with stocks.
Looking ahead, we think the factors underlying bond outperformance since 2000’s start may not persist. For one, it is a relatively new development. Heading into 2020, the S&P 500 was leading 10-year Treasurys over the prior 20 years, 224.2% to 178.1%.[vi] 10-year Treasury and US stock returns’ huge divergence year to date—12.8% versus -11.5%, respectively—has helped generate the bond outperformance headlines note.[vii] 10-year Treasurys’ big year-to-date gains came as their yields declined to present record lows (currently 0.7%).[viii] This reflects the “flight to quality” common in a stock bear market, when negative volatility typically leads jittery investors to bid up perceived “safe haven” assets, especially Treasurys. When the panic subsides, bond prices typically retreat some. We wouldn’t be surprised to see this materialize in this bear market’s aftermath, too. Hence, drawing big, forward-looking conclusions from short-term volatility in stocks and bonds seems like an error to us.
A second force underlying bonds’ post-2000 outperformance is the longer-term decline in bond yields. 10-year Treasury yields topped out above 15% in September 1981 and have zigged and zagged downwards since.[ix] In February 2000, the 10-year yield at issuance was 6.5%.[x] While we don’t expect a surge, we also don’t think yields have much further to fall now—particularly if economic reopening persists and growth returns.
During bear markets, it is normal to see some question whether stocks are worth owning, or are simply not worth the volatility risk. But we think this primarily reflects depressed sentiment. In our view, data overwhelmingly support the notion that stocks’ higher returns over long periods have historically compensated investors for the risk. Presuming the future will be different could be very dangerous for investors needing long-term growth.
[i] Source: Global Financial Data, as of 5/5/20. USA 10-Year Government Bond Total Return Index and S&P 500 Total Return Index, 12/31/1999 – 5/4/2020.
[ii] “Question Everything You Know About Bonds Versus Stocks,” Nir Kaissar, Bloomberg, 4/21/2020.
[iii] Source: Global Financial Data, as of 5/5/20. USA 10-Year Government Bond Total Return Index and S&P 500 Total Return Index, 1/1/1929 – 12/31/1948 and 1/1/1989 – 12/31/2008.
[iv] Ibid. USA 10-Year Government Bond Total Return Index and S&P 500 Total Return Index, 12/31/2008 – 5/4/2020.
[v] Ibid. USA 10-Year Government Bond Total Return Index and S&P 500 Total Return Index, 12/31/1928 – 12/31/1948 and 12/13/1988 – 12/31/2008.
[vi] Ibid. USA 10-Year Government Bond Total Return Index and S&P 500 Total Return Index, 12/31/1999 – 12/31/2019.
[vii] Ibid. USA 10-Year Government Bond Total Return Index and S&P 500 Total Return Index, 12/31/2019 – 5/4/2020.
[viii] Source: FactSet, as of 5/5/2020.. 10-year US Treasury yield (constant maturity), 9/30/1981 – 5/5/2020.
[ix] Source: FactSet, as of 5/5/2020. 10-year US Treasury yield (constant maturity), 5/5/2020.
[x] Source: TreasuryDirect, as of 5/4/2020. Interest rate on a 10-year US Treasury note auctioned on 2/9/2000.
If you would like to contact the editors responsible for this article, please message MarketMinder directly.
*The content contained in this article represents only the opinions and viewpoints of the Fisher Investments editorial staff.
Get a weekly roundup of our market insights
Sign up for our weekly e-mail newsletter.

You Imagine Your Future. We Help You Get There.
Are you ready to start your journey to a better financial future?

Where Might the Market Go Next?
Confidently tackle the market’s ups and downs with independent research and analysis that tells you where we think stocks are headed—and why.
Related Resources
-
Market Analysis The New Tariffs in Town Are Still Old News2026-07-24
-
Expert Commentary This Week in Review | Market Volatility, Tariffs, SpaceX
 2026-07-24
 -
Expert Commentary Why Ken Fisher Is Optimistic About European Stocks
 2026-07-23
 -
Economics A Summertime Check-in on US Consumers2026-07-23


Learn More
Learn why 210,000 clients trust us to manage their money and how Fisher Investments and its affiliates may be able to help you achieve your financial goals.
As of 6/30/2026
New to Fisher? Call Us.
Contact Us Today