Personal Wealth Management / Market Analysis
The Low-Down on Q1’s US GDP Downtick
A look beneath the hood at US Q1 GDP and economic developments since.

Editors’ Note: MarketMinder doesn’t make individual security recommendations. Any stock mentioned herein is merely incidental to the broader topic we aim to highlight.
Thursday morning, the US Bureau of Economic Analysis (BEA) released the advance estimate of US Q1 2022 GDP, which contracted -1.4% annualized.[i] Coming against expectations of 1.1% growth and amid widespread recession fears, this result likely surprises many and may add to widespread recession worries. Yet under the hood, we find little here surprising—or troubling for stocks. Let us show you.
First, consider the details. The pure private-sector GDP components—consumer spending and investment in non-residential structures, equipment, intellectual property and housing—rose and accelerated from Q4 2021, when headline GDP grew 6.9% annualized. (Exhibit 1)
Exhibit 1: Contributions to Growth From Pure Private-Sector Components
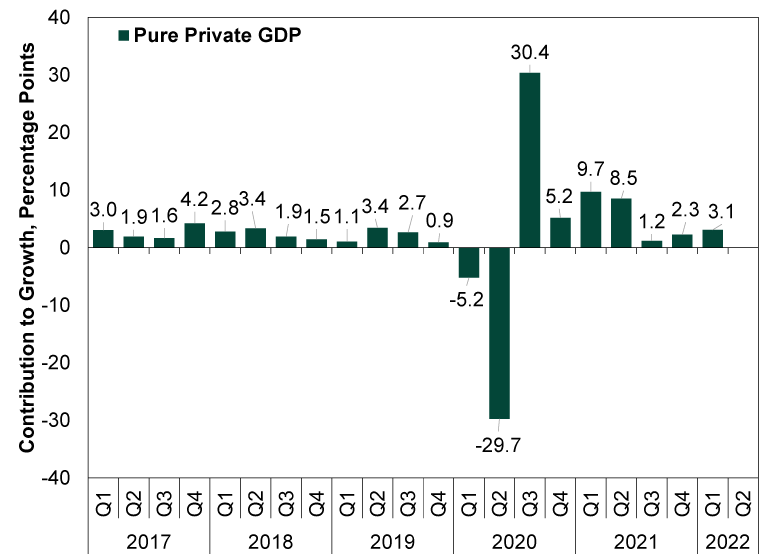
Source: BEA, as of 4/28/2022. Q1 2017 – Q1 2022.
How did these broad categories, which total 86.7% of US GDP, accelerate while headline growth contracted?[ii] Simple. Q4 2021’s growth was skewed higher by vast business investment in inventories, which added more than five percentage points to headline growth.[iii] That was likely firms plowing capital into rebuilding inventories and in anticipation of continued supply chain issues. In Q1 2022, that fell off a cliff, with inventory change subtracting -0.84 point, meaning you got more than a six percentage point swing from this one tiny category of the US economy.[iv] A reversal in inventory changes’ contribution shouldn’t surprise—nor is a decline in inventory change necessarily bad. In our view, this should actually quell one rather realistic economic fear we have monitored lately: That firms would over-invest in inventory, only to see demand falter and leave them with excess, driving down pricing. That rather traditional recession recipe doesn’t seem to be materializing in the data after Q1’s release. Rather, it looks like strong demand ran down stockpiles a bit.
Beyond inventories, government spending also fell -2.7% annualized, detracting -0.48 point from headline growth, largely because some pandemic-related relief spending dried up.[v] But this, too, shouldn’t shock. Such measures were always going to end and, like inventory change, one can debate whether a bigger or smaller contribution from government consumption is economically good or bad. And, the other unsurprising piece: While consumer spending overall grew 2.7% annualized, adding 1.83 points to headline growth, goods spending was flat while services boomed 4.1% higher.[vi] Note that these figures are inflation-adjusted—not boosted artificially by high prices.
This pattern, which we have long expected tied to lifting COVID restrictions and pent-up demand for things like travel, echoes corporate executives’ commentary and data from conference calls. In the last two days, payment technology firms Visa and Mastercard both reported resurgent overseas transaction volumes, suggesting travel is making a comeback. In its filing Tuesday, Google’s parent company Alphabet reported search volumes related to travel are also up.
You can see this goods-versus-services flip flop in Exhibit 2, which plots the cumulative contribution to growth from services and goods spending over the past five years. As shown, services spending—even now almost twice as large as goods spending—absolutely tanked in the pandemic while goods consumption soared after a brief blip. This likely pulled some goods demand forward, which may explain the slow growth now, while services spending advances.
Exhibit 2: Services Versus Goods Spending
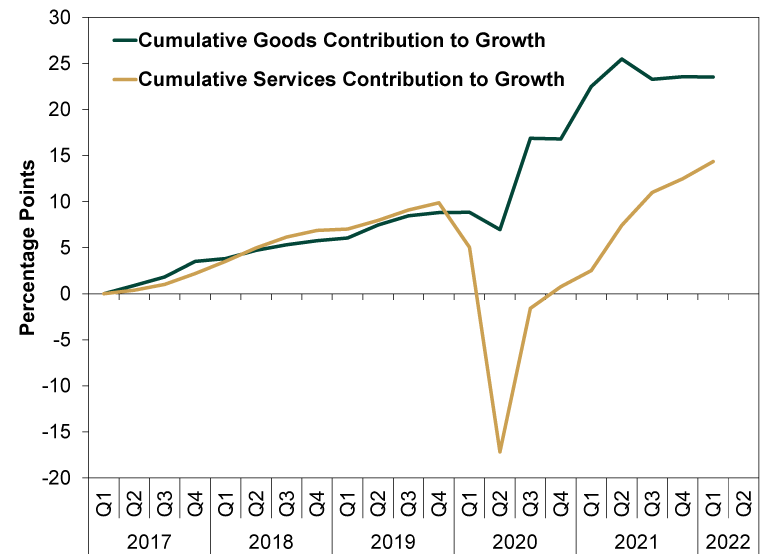
Source: BEA, as of 4/28/2022. Cumulative contributions to growth, Q1 2017 – Q1 2022.
Lastly, imports vastly outweighed exports. Imports are subtracted from headline GDP, a means to offset their inclusion in other categories, like spending, and thereby give a better read of one nation’s economic activity.
Beyond this, we think it may also be worth recalling that Q1 GDP data have a more than 40-year history of downward skew, tied to issues with seasonal adjustment—issues that have grown rather than shrunk in recent years.[vii] (Seasonal adjustment is an econometric modeling approach that aims to smooth out repeat, calendar-related impacts on growth, like the typical holiday-related spending surge in Q4, following by a crash in Q1). This is a well-documented phenomenon in the economics community, which the BEA has attempted to identify and fix more than once.[viii] Now, perhaps they have fixed the adjustment, but we doubt it. Pandemic-related skew has wreaked havoc on seasonal adjustment factors used in an array of series from jobless claims to GDP and more. This doesn’t fully erase the contraction, of course. But we think it should be a cautionary tale for those drawing huge, forward-looking conclusions from it.
Of course, Q1 ended 28 days ago, so one may wonder what the economy’s state is since. We don’t have many formal data points to rely on just yet, beyond preliminary purchasing managers’ indexes—surveys tallying the breadth of growth across the economy—which point to fairly healthy US economic activity. These gauges don’t tell you anything about the magnitude of growth, though—just its breadth. But if you look to less-traditional measures of activity, you can see some signs of expansion continuing. Take, for example, these:
- Restaurant reservation service OpenTable’s data show seated diners at US restaurants spent most of this month hovering around April 2019 levels, continuing a recovery to pre-pandemic levels of activity.[ix]
- Through April’s first 27 days, the Transportation Security Administration reports 57,025,545 passengers have passed through security at America’s airports—53.4% above the comparable period last year and just -9.6% below 2019 levels.[x]
- In the week of April 17 – 23, US hotel occupancy was at 65.8%, down just -4.2% from 2019’s pre-pandemic period. That is despite average daily hotel rates rising 15.4% over this span.[xi]
- Goods shipping via train is a little soft, according to the American Association of Railroads, averaging -4.8% y/y in April’s four weekly reports to date. But that would seemingly echo the services-versus-goods split above all else.[xii]
- Meanwhile, in the Energy sector, April 22’s Baker Hughes tally of US rigs actively drilling for oil and gas rose 59% y/y.[xiii]
Now, take these data with a grain of salt. They are limited. They aren’t seasonally adjusted and base effects could skew them. But they don’t really suggest economic activity has fallen off a cliff this month. We would suggest that, in concert with corporate executives’ recent commentary, the preponderance of the evidence suggests Q1 GDP’s small contraction isn’t a harbinger of bigger trouble ahead. That is doubly true when you consider the US Leading Economic Index rose 0.3% m/m in March and 0.6% in February, extending an uptrend.[xiv] That suggests to us a recession isn’t likely in the offing now.
It wouldn’t surprise us if Q1’s contraction served a different purpose: Allowing bearish pundits to see their concerns as validated—and move on. That is rather typical correction behavior, and it can be key to sentiment morphing. Only time will tell if that holds now, but we suspect it may partly explain why stocks surged after the data dropped.
[i] Source: BEA, as of 4/28/2022.
[ii] Ibid.
[iii] Ibid.
[iv] Ibid.
[v] Ibid.
[vi] Ibid.
[vii] “Assessing Residual Seasonality in the U.S. National Income and Product Account Aggregates,” Baoline Chen, Tucker S. McElroy and Osbert C. Pang, BEA Working Paper Series, January 2021.
[viii] “Why Is the Economy Always So Weak in the First Quarter? Nobody Really Knows,” Steve Liesman, CNBC, 4/22/2015.
[ix] Source: OpenTable, as of 4/28/2022. Seated diners from online, phone and walk-in reservations, April 2022 levels are year-over-three-year growth rates to illustrate the change since pre-pandemic rates.
[x] Source: TSA, as of 4/28/2022.
[xi] Source: STR, as of 4/28/2022.
[xii] Source: FactSet, as of 4/28/2022.
[xiii] Ibid.
[xiv] Source: The Conference Board, as of 4/28/2022.
If you would like to contact the editors responsible for this article, please message MarketMinder directly.
*The content contained in this article represents only the opinions and viewpoints of the Fisher Investments editorial staff.
Get a weekly roundup of our market insights
Sign up for our weekly e-mail newsletter.

You Imagine Your Future. We Help You Get There.
Are you ready to start your journey to a better financial future?

Where Might the Market Go Next?
Confidently tackle the market’s ups and downs with independent research and analysis that tells you where we think stocks are headed—and why.
Related Resources
-
Market Analysis The New Tariffs in Town Are Still Old News2026-07-24
-
Expert Commentary This Week in Review | Market Volatility, Tariffs, SpaceX
 2026-07-24
 -
Economics A Summertime Check-in on US Consumers2026-07-23
-
Expert Commentary Why Ken Fisher Is Optimistic About European Stocks
 2026-07-23


Learn More
Learn why 210,000 clients trust us to manage their money and how Fisher Investments and its affiliates may be able to help you achieve your financial goals.
As of 6/30/2026
New to Fisher? Call Us.
Contact Us Today