Personal Wealth Management / Market Analysis
The Myth of the American Spendthrift
Worries of overstretched consumers running out of steam and bringing on a recession are overblown, in our view.

Financial media often comment on the state of US consumers—be it how much they are spending or saving, how they are feeling or something else. Since consumption comprises about 70% of the economy, this is understandable. But in our view, searching for market risks in perceived consumer trends is often a fool’s errand. Case in point: When the US personal savings rate hit a 12-year low in December at 2.4% of disposable income, coverage warned of “a red flag that markets are getting overheated and households overextended.” January’s data, published Thursday, showed a tax-cut influenced rebound to 3.2%, but even this rate is still quite low by historical standards. While low savings rate fears have taken a backseat to inflation these days, the question remains: Should investors worry US consumers are overstretched? In our view, the answer is no. The personal savings rate isn’t what the term implies. Dig into the numbers, and there is little sign spendthrift consumers are propping up growth or stocks.
To calculate the personal savings rate, the Commerce Department compares after-tax income to personal consumption expenditures. This may sound intuitive, but wacky methodology understates income and ignores how most people save. First, realized capital gains—say, from selling stock—don’t count as income, even though capital gains taxes still subtract. Second, lots of folks—especially retirees—use invested savings (in IRAs and 401(k)s, for example) for cashflow later in life. Others collect payments from employer-sponsored pension and insurance plans. The official savings rate doesn’t notice either. Third, while employer contributions to defined benefit pension plans count as income, strong investment returns mean hitting funding targets requires lower contributions. The result: lower official savings figures even as the actual savings pot keeps growing. Fourth, a business owner investing in his or her business doesn’t count as saving, despite the fact many wholly owned business are included in the owner’s net worth.
Real estate doesn’t escape the calculation weirdness, either. Many see their house as a nest egg and build up equity in it by making extra mortgage payments. While we’d hesitate to call this saving considering a house is illiquid (i.e., hard to sell quickly), we aren’t sure the official definition—classifying mortgage payments as spending—is so accurate either. The omission is a big one—as of Q3 2017, households held $14.1 trillion of real estate equity.[i] Likewise, the measure deducts “imputed rent” from homeowners’ incomes. This figure is fictional—no homeowner pays it. It is the amount they would pay to rent the homes they own. In 2017, imputed rent totaled just over $1.5 trillion.[ii] For comparison, tenants shelled out just $545 billion in rent.[iii]
Thanks to all these oddities, we believe the official savings rate understates true savings and is a misleading snapshot of consumers’ financial well-being. A retired Fortune 500 CEO who owns outright a dozen homes worth triple their purchase price and lives off distributions from his or her enormous investment portfolio could still weigh it down.
A traditional assets-versus-liabilities approach shows US consumers’ finances aren’t fragile. Total household assets rose to $112.4 trillion in Q3 2017, up $2 trillion from Q2.[iv] Subtract liabilities ($15.4 trillion) to find net worth: $97 trillion,[v] or nearly seven times disposable income.[vi] We aren’t saying every household is a model of frugality, but these aren’t figures you would expect in a nation of irresponsible spenders.
Moreover, as with January’s rise, December’s lower savings rate may have been due in part to one-off factors. Those with flexibility in booking income likely delayed some of it until 2018 to take advantage of lower rates under the new tax bill, temporarily lowering income. Plus, higher auto sales helped drive personal consumption expenditures’ December boost. Since the Commerce Department counts the entire cost of buying a car against income in the month of purchase—even though most buyers get financing in order to spread the income hit over time—measured saving takes a hit.
Even at face value, the currently low savings rate isn’t worrisome. As Exhibit 1 shows, the rate has broadly declined since 1959 while household net worth has mostly risen.
Exhibit 1: All That Wealth Must Come From Somewhere
Source: Federal Reserve Bank of St. Louis and the Federal Reserve Board of Governors, both as of 3/1/2018. US Personal Saving Rate, January 1959 – January 2018, and US Households’ Total Assets minus Total Liabilities, Q1 1959 – Q3 2017.
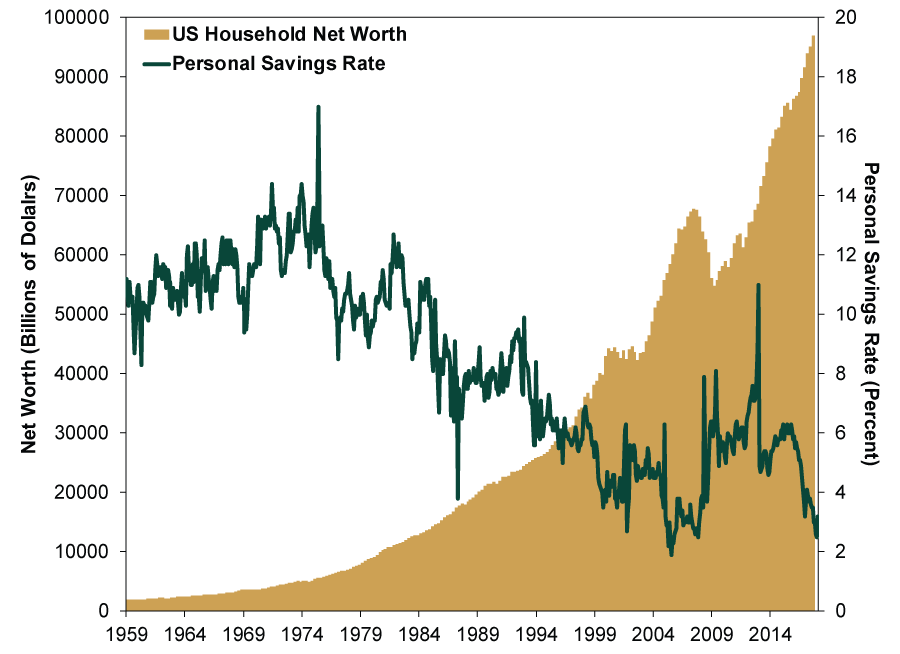
Zeroing in on this expansion: As saving rates roughly halved (from around 6.1% in March 2009 to 3.2% today), American households’ net worth surged 77%.[vii] This contradicts descriptions of consumers as living beyond their means—and further demonstrates the official savings rate’s shortcomings.
This is all academic for investors anyhow, since changes in saving patterns don’t bring on recessions or bear markets. Tough economic times encourage more saving, to be sure, but expansions don’t grind to a halt because tapped-out consumers can’t spend. This was part of the popular narrative in 2006 – 2007, before the last market peak, but that bull market and expansion didn’t end because consumers couldn’t keep it going. Instead, a misguided accounting rule slashed $2 trillion from banks’ balance sheets while an arbitrary and unpredictable government response spread panic. Consumption actually tends to remain pretty stable in recessions while business investment, inventories and exports plummet.
The low savings rate garners attention because it plays into the popular stereotype of the profligate American. But real risks seldom lie in easy headline fodder. Stocks are forward-looking and efficient, instantly pricing in public data like personal savings rates. Using the latter to predict markets is backwards. Worries like these help keep euphoria at bay, giving the bull market more room to run.
[i] Source: US Federal Reserve, as of 3/1/2018. Households; owners’ equity in real estate, Q3 2017.
[ii] Source: US Bureau of Economic Analysis, as of 3/1/2018. Imputed rental of owner-occupied nonfarm housing for 2017.
[iii] Ibid. Rental of tenant-occupied nonfarm housing for 2017.
[iv] Source: US Federal Reserve, as of 3/1/2018. Total assets of households and nonprofit organizations, Q2 – Q3 2017.
[v] Ibid. Net worth of households and nonprofit organizations, Q3 2017.
[vi] Ibid. Net worth as a percentage of disposable personal income for households and nonprofit organizations, Q3 2017.
[vii] Source: Federal Reserve Bank of St. Louis and the Federal Reserve Board of Governors, as of 3/1/2018. US Personal Saving Rate, March 2009 versus December 2017, and percent change in US households’ net worth, Q1 2009 – Q3 2017.
If you would like to contact the editors responsible for this article, please message MarketMinder directly.
*The content contained in this article represents only the opinions and viewpoints of the Fisher Investments editorial staff.
Get a weekly roundup of our market insights
Sign up for our weekly e-mail newsletter.

You Imagine Your Future. We Help You Get There.
Are you ready to start your journey to a better financial future?

Where Might the Market Go Next?
Confidently tackle the market’s ups and downs with independent research and analysis that tells you where we think stocks are headed—and why.
Related Resources
-
Economics Q2 US GDP’s Stealthy Strength2026-07-31
-
Expert Commentary This Week in Review | Fed Meeting, US GDP, Eurozone GDP
 2026-07-31
 -
Market Analysis Don’t Fret the EU’s Low Summertime Gas Storage Levels2026-07-31
-
Economics On Fires and GDP2026-07-30


Learn More
Learn why 210,000 clients trust us to manage their money and how Fisher Investments and its affiliates may be able to help you achieve your financial goals.
As of 6/30/2026
New to Fisher? Call Us.
Contact Us Today