Personal Wealth Management / Economics
Turning Toward Earnings
Aggregate S&P 500 earnings growth was flat in Q3, but this bull market still has room to run.

Q3 earnings season’s winding down, with 487 S&P 500 companies reporting through Friday and 6 more up this week. For companies reporting thus far, aggregate earnings per share (EPS) grew 0.1% year over year1—a lackluster headline figure, but not necessarily indicative of the bull market’s end or economic headwinds.
Earnings typically slow or even contract as bull markets mature, and historically, slowing earnings haven’t automatically meant slowing equity returns. As Exhibit 1 shows, when earnings have slowed or contracted during bull markets, stocks have averaged double digits over the following year.
Exhibit 1: Slowing/Declining EPS Growth and 12-Month Forward Returns
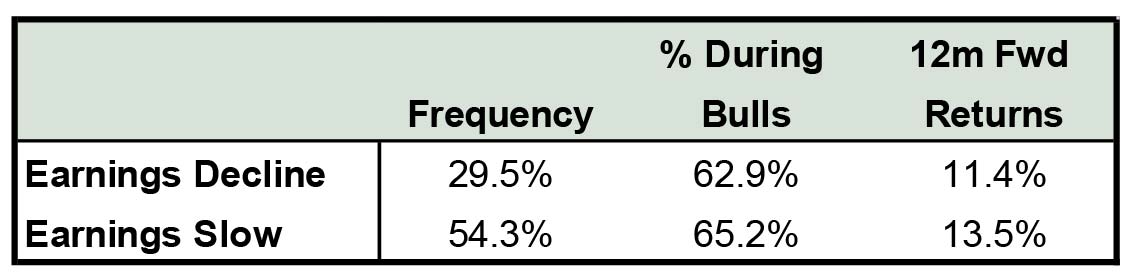
Source: Global Financial Data, Inc., S&P 500, Fisher Investments Research, as of 10/31/2012.
Case in point: Earnings growth slowed during much of the 1990s bull market, but stocks marched on. (Exhibits 2 and 3.)
Exhibit 2: S&P 500 EPS Growth (y/y), 1990 – 1999
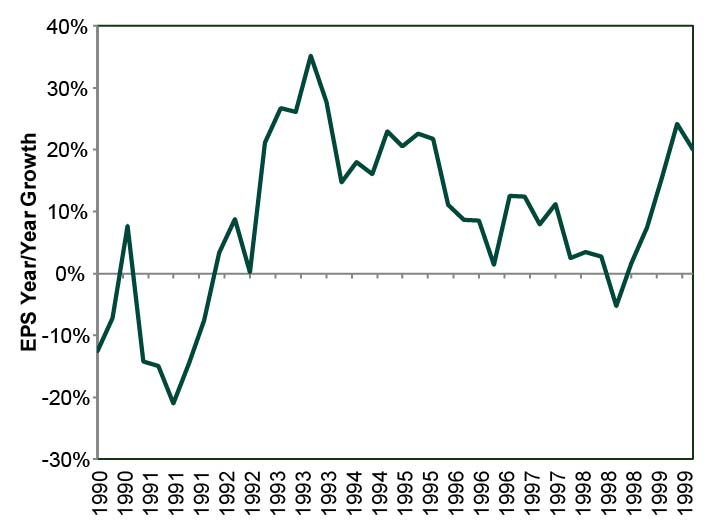
Source: Thomson Reuters, Standard and Poor’s, as of 10/31/2012.
Exhibit 3: S&P 500 Total Return, 1990 – 1999
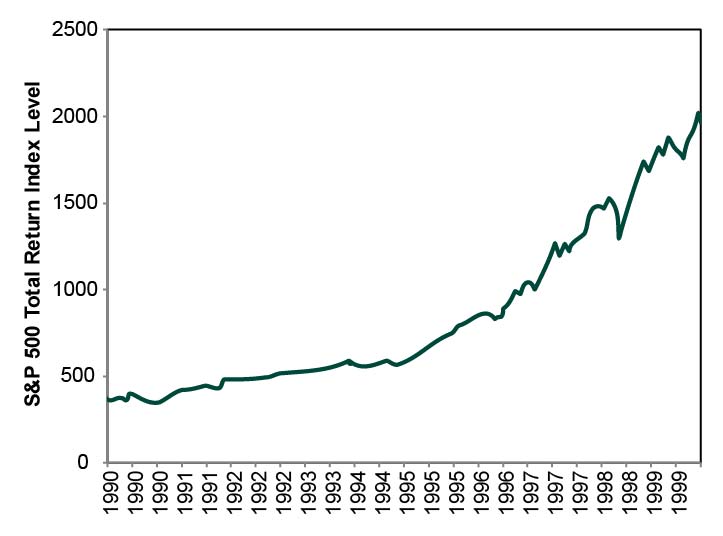
Source: Thomson Reuters, as of 10/31/2012.
One big reason Q3 earnings were flattish: Q3 2011 set a high benchmark for y/y comparisons. Then, aggregate EPS grew nearly 20% y/y, logging an all-time high of $239.2 billion. Gangbusters growth off that high base would be a somewhat unreasonable expectation, especially after 3.5 years of bull market and 11 straight quarters of EPS growth—hence, when earnings season began, analysts expected a modest contraction. That results defied expectations and aggregate earnings inched up to $239.3 billion is nothing to sneeze at.
Taking a more granular look, while aggregate earnings barely grew, results weren’t uniformly weak. Five sectors saw earnings growth, with Consumer Discretionary leading the way at 12.3% y/y. Energy and Materials provided most of the weakness. Their aggregate EPS fell -16.4% and -26.6%, respectively, mostly due to falling commodity prices—not necessarily a sign of economic weakness. In fact, cheaper commodities could buoy other industries’ earnings in the period ahead due to reduced input costs. The sectoral disparity was even starker in top-line figures. Aggregate S&P 500 revenue-per-share (RPS) fell -0.8%, but only Energy and Materials contracted. The remaining sectors averaged 2.3% y/y aggregate RPS growth, signaling plenty of underlying health in the US economy.
So despite slowing earnings, stocks and the economy should be fine. But that doesn’t mean all market segments have equally bright outlooks. As bull markets mature and earnings growth tapers, the biggest companies—those “mega caps” exceeding the market’s weighted average market cap—tend to do best. In these environments, investors look for companies they believe best able to weather the storm. They seek traits like earnings stability, balance sheet strength, strong brand names, high market share and geographically diverse revenue streams—hallmarks of mega caps. Thus, the biggest firms have historically outperformed small cap by a wide margin in late-stage bull markets. This trend appeared to take hold earlier this year, and mega likely carries the torch for the foreseeable future.
Looking ahead, a flattish Q3 doesn’t mean earnings must stagnate—analysts expect growth to pick up. Aggregate EPS growth is currently expected to reaccelerate to 4.2% in Q4 and higher in 2013. Granted, expectations have ratcheted down in recent weeks, but that’s been the case much of this bull market. Earnings have consistently beaten too-dour expectations, and that trend seems unlikely to abate soon. Yes, risks are ever-present, but fundamentals remain stronger than most appreciate. Corporations are healthy, growing and profitable, and in our view, this bull market has room to run.
1Source: Thomson Reuters, “This Week in Earnings,” November 23, 2012.
If you would like to contact the editors responsible for this article, please message MarketMinder directly.
*The content contained in this article represents only the opinions and viewpoints of the Fisher Investments editorial staff.
Get a weekly roundup of our market insights
Sign up for our weekly e-mail newsletter.

You Imagine Your Future. We Help You Get There.
Are you ready to start your journey to a better financial future?

Where Might the Market Go Next?
Confidently tackle the market’s ups and downs with independent research and analysis that tells you where we think stocks are headed—and why.
Related Resources
-
Economics Quick Hit: Durably Broad-Based Growth2026-07-29
-
Market Analysis On the Chop in the Oil Market2026-07-29
-
Politics Takaichi Raises Japan’s Wall of Worry2026-07-27
-
In The News Why Kevin Warsh should think twice about hiking interest rates — even as anxiety over the Iran war grows2026-07-27


Learn More
Learn why 210,000 clients trust us to manage their money and how Fisher Investments and its affiliates may be able to help you achieve your financial goals.
As of 6/30/2026
New to Fisher? Call Us.
Contact Us Today