Personal Wealth Management / Market Analysis
What Underlying Trends Say About This Bear Market
Leadership trends suggest this bear market is acting more like a correction.

Bear markets—fundamentally driven declines exceeding -20%—usually take time to develop. Not so this time. While the average US bear market since 1925 took 8 months to hit the -20% mark, this one took 16 trading days—by far history’s fastest.[i] World stocks entered a bear market similarly quickly—20 trading days.[ii] This bear market’s speed is highly atypical—and is more in keeping with historical corrections (sentiment-driven moves of about -10% to -20%). Thus far, this bear market has another similarity to corrections: Leadership hasn’t shifted.
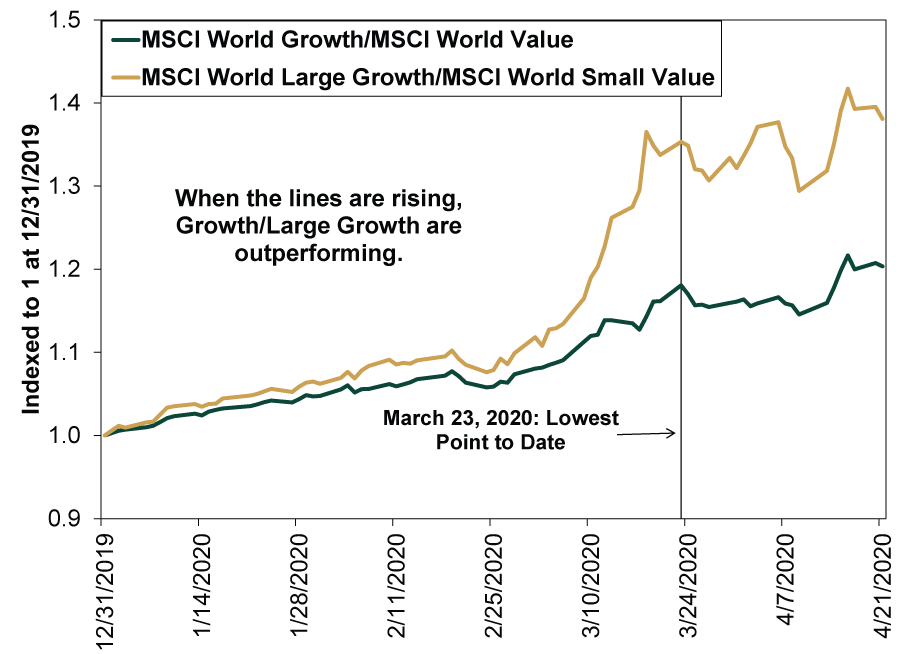
From the bear market’s beginning to now, growth and large-cap growth stocks have outperformed value and small-cap value. The MSCI World Index peaked February 12, falling -34.0% to its March 23 low.[iii] As Exhibit 1 shows, global growth stocks have beaten value by a whopping 11.9 percentage points over this same time period.[iv] The difference is even starker between large-cap growth stocks and small-cap value: 26.6 percentage points.[v] Now, this isn’t unusual on the downside in a bear market—smaller, value-oriented firms tend to be more sensitive to economic cycle shifts. Recession causes many investors to fear such firms won’t survive, causing them to trail in the decline. However, since the lowest point seen to date on March 23, large-cap growth is continuing to outperform small-cap value—unlike most recoveries from bear markets.
Exhibit 1: Large Growth Leading Small Value Throughout 2020
Source: FactSet, as of 4/23/2020. MSCI World Growth Index and MSCI World Value Index, both with net dividends and indexed to one at 12/31/2019. MSCI World Large-Cap Growth Index and MSCI World Small-Cap Value Index, both with net dividends and indexed to one at 12/31/2019. Each line plots the growth index divided by the value index. 12/31/2019 – 4/22/2020.
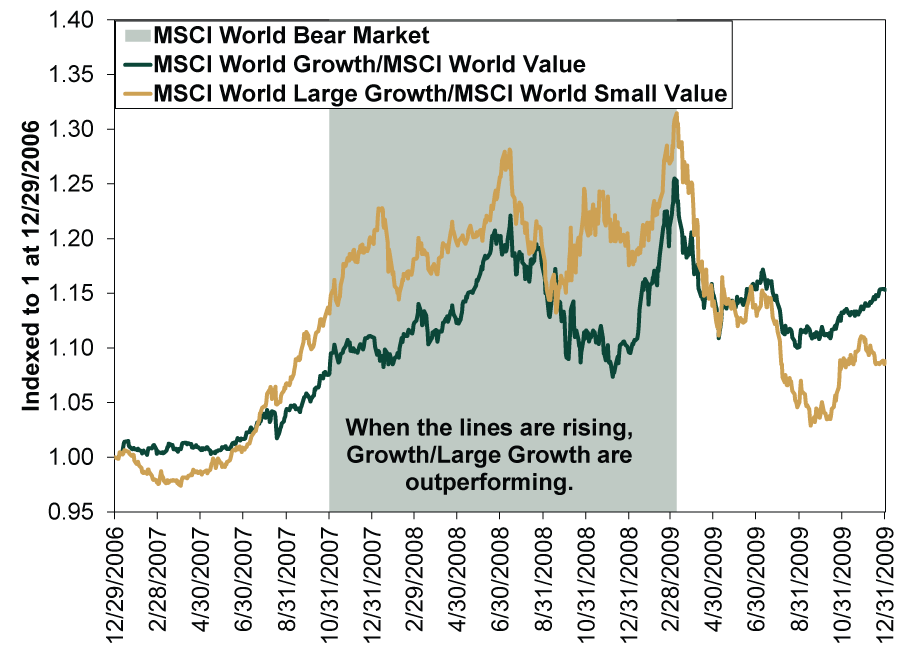
Usually, small value stocks surge ahead in early bull markets, benefiting from relief as dour expectations tied to the economy reverse. Exhibit 2, which plots leadership around 2007 – 2009’s global financial crisis, shows this well. Note the huge flip-flop in leadership before and after the shaded period.
Exhibit 2: Style Leadership Before, During and After 2007 – 2009’s Bear Market
Source: FactSet, as of 4/23/2020. MSCI World Growth Index and MSCI World Value Index, both with net dividends and indexed to one at 12/31/2006. MSCI World Large-Cap Growth Index and MSCI World Small-Cap Value Index, both with net dividends and indexed to one at 12/31/2006. Each line plots the growth index divided by the value index. 12/31/2006 – 12/31/2009.
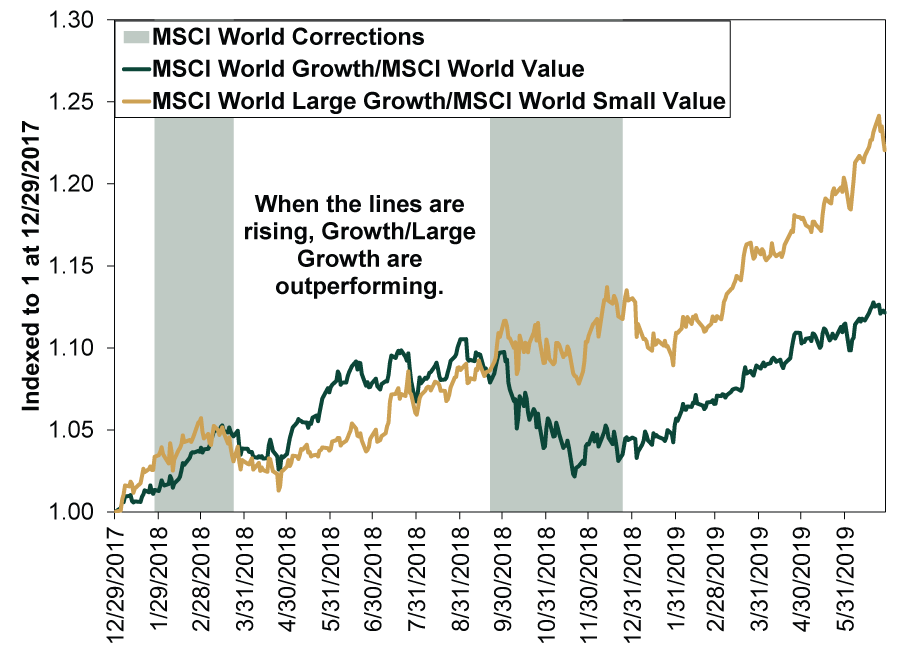
While we can’t say March 23 is definitively this bear market’s low, if it is, then the recovery looks much more like the bounce after a correction than a rebound from a bear market. After a correction, leadership from before the downturn tends to resume. Exhibit 3 illustrates this, using 2018’s two global corrections. Prior to the year’s first correction, growth had led value for years. That persisted until late in the pullback, when value flipped ahead for a short stretch. Pundits claimed a lasting rotation was afoot. But within weeks, large growth was again in pole position. A longer and deeper correction struck later that autumn. During the correction, value generally led, leading many pundits to again expect a lasting rotation. As you can see, that didn’t happen.
Exhibit 3: Style Leadership Before, During and After 2018’s Corrections
Source: FactSet, as of 4/23/2020. MSCI World Growth Index and MSCI World Value Index, both with net dividends and indexed to one at 12/29/2017. MSCI World Large-Cap Growth Index and MSCI World Small-Cap Value Index, both with net dividends and indexed to one at 12/29/2017. Each line plots the growth index divided by the value index. 12/29/2017 – 6/28/2019.
Corrections, being sentiment-driven and not fundamental, tend not to shift prevailing economic trends. Now, this bear market has a clear and powerful fundamental underpinning—the business disruptions brought by society’s COVID-19 response—but how lasting are they? Some pundits claim capital markets have permanently changed because bear market recoveries’ traditional value leadership is absent. Yet the economy was neither frothy nor deteriorating pre-bear market, more like your typical correction and unlike most other bear markets. This was about a sudden interruption that forced markets to reckon with the growing likelihood of contraction. That is a core difference between this and most bear markets, and we think it means economic trends could resume in short order if the interruptions to business lift. The economy doesn’t need time to work off economic excess. Still others suggest big growth contains more firms insulated from social distancing-restrictions. That perhaps holds with their outperformance on the downside. But in upturns, you would expect to see worse-positioned firms lead—key to value’s typical post-bear market leadership—again, on relief.
If shutdowns prove lasting, a style rotation favoring value could still happen. We don’t know that March 23 is the low, and if business disruptions persist, a more typical post-bear market recovery may ensue. But we think it is worth noting that, if this upturn is the new bull market, this most unusual bear market will have ended oddly, too.
[i] Source: Global Financial Data, Inc. and FactSet, as of 4/27/2020. S&P 500 price index, 12/31/1925 – 4/27/2020.
[ii] Source: FactSet, as of 4/27/2020. MSCI World price index, 2/12/2020 – 3/12/2020.
[iii] Ibid. MSCI World Index with net dividends, 2/12/2020 – 3/23/2020.
[iv] Ibid., as of 4/23/2020. MSCI World Growth Index and MSCI World Value Index, both with net dividends and indexed to one at 12/31/2019, 2/12/2020 – 3/23/2020.
[v] Ibid. MSCI World Large-Cap Growth Index and MSCI World Small-Cap Value Index, both with net dividends and indexed to one at 12/31/2019, 2/12/2020 – 3/23/2020.
If you would like to contact the editors responsible for this article, please message MarketMinder directly.
*The content contained in this article represents only the opinions and viewpoints of the Fisher Investments editorial staff.
Get a weekly roundup of our market insights
Sign up for our weekly e-mail newsletter.

You Imagine Your Future. We Help You Get There.
Are you ready to start your journey to a better financial future?

Where Might the Market Go Next?
Confidently tackle the market’s ups and downs with independent research and analysis that tells you where we think stocks are headed—and why.
Related Resources
-
Economics Quick Hit: Durably Broad-Based Growth2026-07-29
-
Market Analysis On the Chop in the Oil Market2026-07-29
-
In The News Why Kevin Warsh should think twice about hiking interest rates — even as anxiety over the Iran war grows2026-07-27
-
Expert Commentary 3 Things You Need to Know This Week | Fed Meeting, US Q2 GDP, Eurozone Inflation
 2026-07-27


Learn More
Learn why 210,000 clients trust us to manage their money and how Fisher Investments and its affiliates may be able to help you achieve your financial goals.
As of 6/30/2026
New to Fisher? Call Us.
Contact Us Today