Personal Wealth Management /
Why Shale Oil's Boom Didn't Buoy Energy Stocks
What investors can learn from the Energy sector’s past decade.

The US shale oil boom has been one of the big economic stories of the past decade, reversing what many thought was an inexorable decline and transforming America into the world’s biggest oil producer. But that progress hasn’t translated into big market returns for US Energy firms. Perhaps counterintuitively, while production boomed in the last decade, Energy stocks sagged. In our view, this shows one seemingly big economic positive doesn’t necessarily translate into hot market returns. We also think it shows the dangers of presuming the recent past predicts the future—something investors should keep in mind when weighing what to do with Energy from here.
To understand the US Energy renaissance story, look first to oil prices in 2000’s first decade. Here is a chart.
Exhibit 1: Oil Prices Popped in the 2000s
Source: Federal Reserve Bank of St. Louis, Crude Oil Prices: West Texas Intermediate (WTI) – Cushing Oklahoma, daily, 12/31/2000 – 12/31/2010.
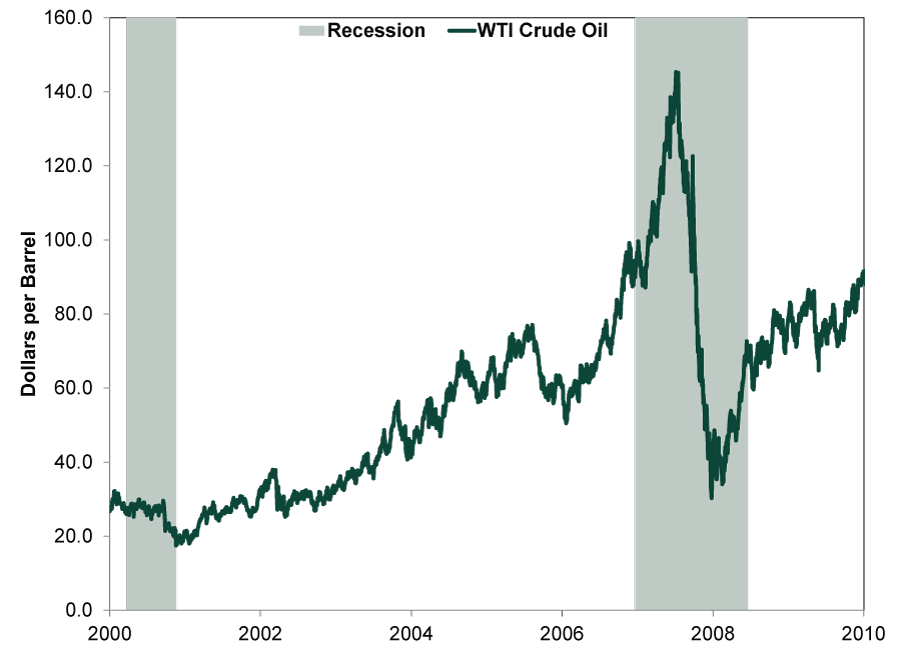
Commodity cycles often follow persistent price trends. As oil prices climbed throughout the mid-2000s, US producers began investing in the technology and processes (e.g., hydraulic fracturing, or “fracking”) to tap America’s vast shale oil reserves. Though fracking wasn’t a new technique—and shale’s big reserves weren’t new discoveries—the costs were high, so extracting this oil previously wasn’t economical. High oil prices changed that. Even after prices cratered during the 2008 – 2009 global financial crisis, most presumed prices would return to their prior heights once growth returned. This appeared to be the case in the early 2010s when oil rebounded. But shale changed the global oil landscape as US producers’ investments started paying off.
Consider: In 2008, the US produced 5 million barrels of oil per day (bpd)—the lowest since 1946.[i] In 2012, that number climbed to 6.5 million bpd; then 8.8 million bpd in 2014.[ii] By 2018 the US was pumping close to 11 million bpd—exceeding both its 1970s peak of 9.6 million bpd and supplanting oil behemoths Saudi Arabia and Russia as the world’s top producer.[iii] The EIA estimates US crude oil production averaged around 12.2 million bpd in 2019, and US crude oil exports have surged ever since Congress lifted an export ban in 2015.[iv] At first blush, these developments might seem like a boon for the Energy sector: Firms took risks, the investments paid off in increased output and, when the practice gained popularity, overall US production skyrocketed.
But reality is more complex, and massive changes that bring big economic positives aren’t necessarily good for the sector where they occur. In this case, the US’s production boom caused oil prices to fall. From the mid-2000s to the early-2010s, hot demand—particularly from rapid economic growth in China and other Emerging Markets—supported higher oil prices. But as growth cooled, energy demand growth eased—yet energy output, buttressed by the US, kept accelerating. Eventually supply outpaced demand, causing prices to crash from 2014 – 2016. Since then, robust supply has kept a lid on oil prices. Markets reflect US Energy stocks’ struggles in this environment.
Exhibit 2: Energy Stocks’ Tough Decade
Source: FactSet, as of 1/13/2020. S&P 500 Total Return Index and S&P 500 Energy Total Return Index, 3/9/2009 – 1/10/2020. Indexed to 100 on 3/9/2009.
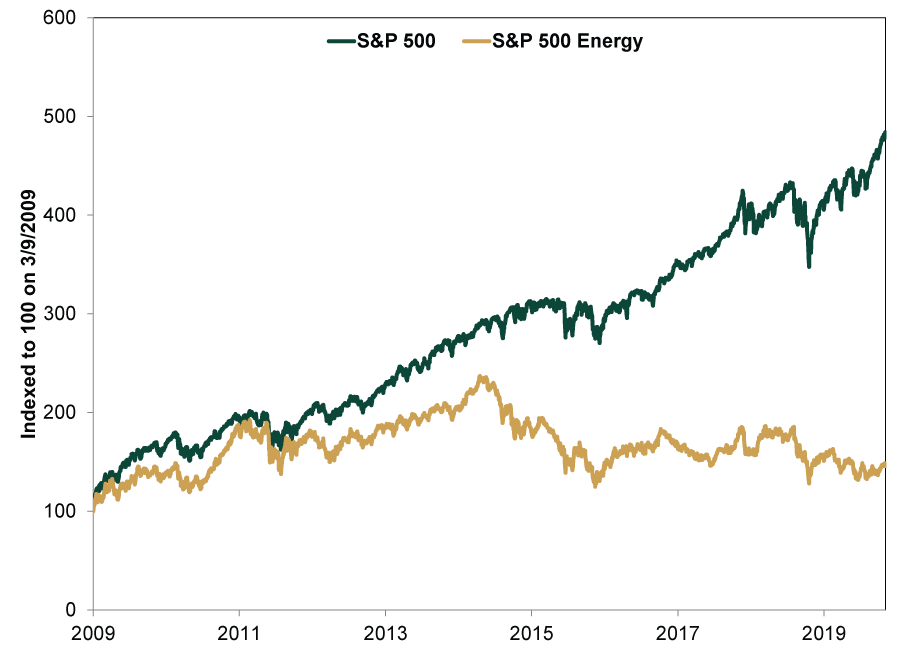
The primary reason for those market struggles: Energy companies’ earnings and revenues are more oil price-sensitive than volume-sensitive. As they participated in the shale oil boom, many Energy firms pursued growth at all costs—an expensive endeavor. Companies must invest in exploratory efforts and land leases before production starts—sunk costs they aim to eventually recoup. They also have to pour resources into infrastructure, overhead costs, taxes and labor. When oil prices were higher, producers had bigger margins, allowing them to be more adventurous in their spending. But when prices plummeted, that wiggle room vanished—especially since many producers failed to produce positive cash flow. In the reckoning, some smaller firms did go bankrupt. Many small firms that survived had to make some changes—especially as shareholders started demanding an emphasis on profits rather than growth alone.
However, even as Energy firms tightened their belts, US production continued growing—a testament to the improvements in fracking technology and techniques. Greater efficiency and cost-saving have lowered producers’ “breakeven points”—the price where losses flip to profits—incentivizing firms to continue pumping to recoup something on their investments. Moreover, producers have already invested in many drilled but uncompleted wells (DUCs), which they can tap and start pumping when prices make it worth their while. US oil supply doesn’t look like it will be drying up any time soon.
Still, some fret over the shale boom’s dimming prospects and the implications for US Energy firms. In our view, investors should look to the foreseeable future rather than what just happened. Right now, oil demand is still healthy as the global expansion hums along, and supply remains robust. In other words, the status quo. But smaller shale producers have faced increased difficulty in accessing funding—forcing them to rein in operations—as shareholders demand greater fiscal discipline after years of paltry returns. In our view, that creates an opportunity for the largest, globally oriented firms. Such firms are already usually in favor in a bull market’s latter stages. Opportunities in America’s shale patch for mega-cap Energy firms with strong balance sheets only add to their relative attraction.
[i] Source: EIA, “U.S. Field Production of Crude Oil, Thousand Barrels per Day,” as of 1/15/2020.
[ii] Ibid.
[iii] Ibid.
[iv] Source: EIA, “Short-Term Energy Outlook,” as of 1/14/2020.
If you would like to contact the editors responsible for this article, please message MarketMinder directly.
*The content contained in this article represents only the opinions and viewpoints of the Fisher Investments editorial staff.
Get a weekly roundup of our market insights
Sign up for our weekly e-mail newsletter.

You Imagine Your Future. We Help You Get There.
Are you ready to start your journey to a better financial future?

Where Might the Market Go Next?
Confidently tackle the market’s ups and downs with independent research and analysis that tells you where we think stocks are headed—and why.
Related Resources
-
Expert Commentary Why Ken Fisher Is Optimistic About European Stocks
 2026-07-23
 -
Economics A Summertime Check-in on US Consumers2026-07-23
-
Market Analysis Why the SOX “Bear Market” Isn’t Foreboding2026-07-21
-
Politics Blunting Burnham?2026-07-21


Learn More
Learn why 210,000 clients trust us to manage their money and how Fisher Investments and its affiliates may be able to help you achieve your financial goals.
As of 6/30/2026
New to Fisher? Call Us.
Contact Us Today