


Personal Wealth Management / Market Analysis
About Those ‘Spiking’ French Yields
Alarm over a French debt blowout looks overblown to us.

French debt warnings, like other developed markets’, are blaring in headlines we read. But as in America and elsewhere, we think a look at the data shows France is on fine footing. This looks like another false alarm to us—part of stocks’ bullish backdrop, particularly outside the US.
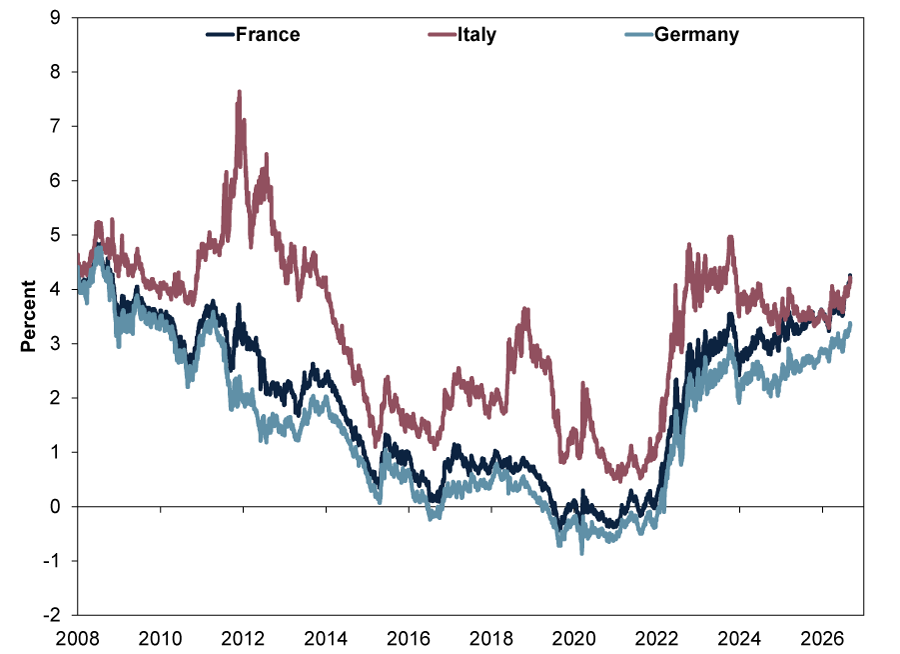
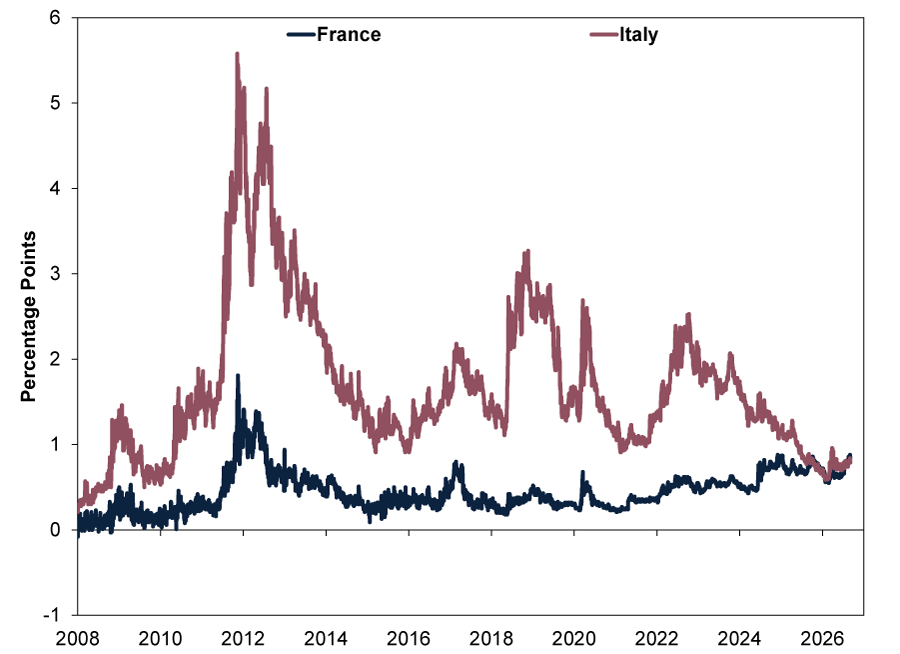
Many commentators we follow notice 10-year French yields hitting 4.18%, their highest since 2008. (Exhibit 1) This has them 0.84 percentage point above comparable German yields, a spread seen in 2012’s eurozone debt crisis. (Exhibit 2) These commentators conclude this is markets’ bracing for budget negotiations and next year’s presidential elections, both of which will allegedly worsen France’s financial standing.[i] Meanwhile, ratings agencies warn France could face further downgrades following last fall’s budget brinksmanship if the government doesn’t stanch red ink and debt continues climbing.[ii]
Exhibit 1: France & Co.’s 10-Year Government Bond Yields
Source: FactSet, as of 4/9/2026.
We don’t think the political facts here are in dispute: Neither of the leading candidates for France’s April 2027 election is running on debt reduction. Rather, both tout policies that would lead to more fiscal largesse—an alleged “nightmare scenario” for financial markets.[iii] Current polling leader Marine Le Pen rejects austerity to bring the budget under control, pledging France’s retirement age will stay at 62 (though she backs windfall taxes on Energy companies, few we follow see this as a path toward fiscal health).[iv]
Current second-place candidate Jean-Luc Mélenchon promises to take €600 billion of French government bonds held by the Bank of France and wider Eurosystem, some 18% of the total, and “chuck it in the fire.”[v] Critics we read say such debt cancelation would leave a gaping capital hole at the monetary policy institution. They say this debt monetisation (printing money to buy bonds) would spark white-hot French inflation (economywide price increases) and risk its ability to finance itself in markets more broadly. Some warn it would force France out of the eurozone. Quelle horreur! Many commentators we follow claim this is why French 10-year sovereign yields have overtaken Italy’s.
Exhibit 2: French and Italian Credit Spreads—Their Yields Minus Germany’s
Source: FactSet, as of 4/9/2026.
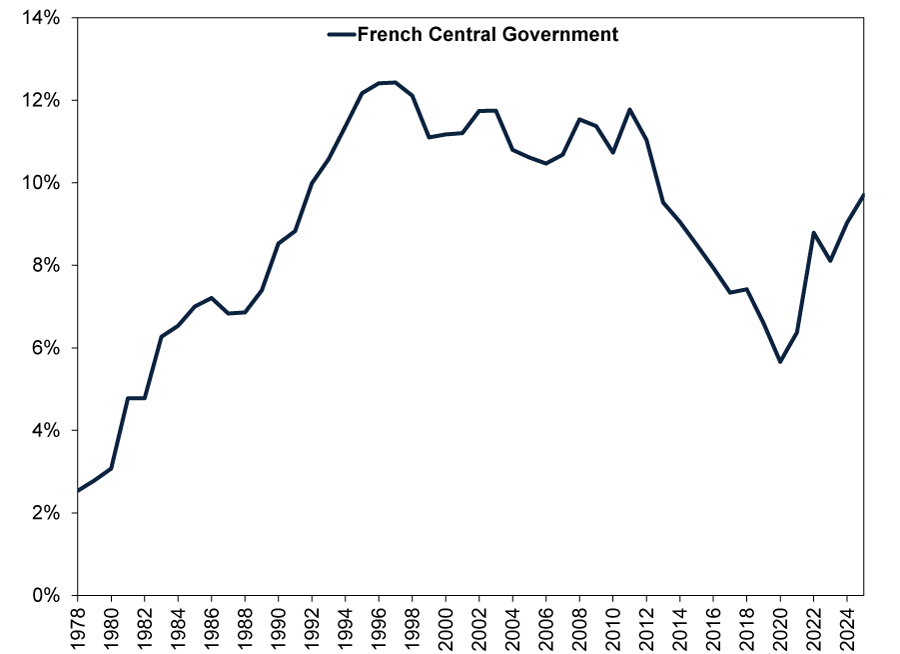
But beware extrapolating sentiment-fuelled volatility as a fundamental shift. Strip away the hype, and we find France’s fiscal standing doesn’t appear so uncertain. As Exhibit 3 shows, French central government debt service is only 10% of its revenue. That is half the ratio of America’s, which we don’t view as cause for crisis considering some boom times accompanied similarly expensive US bond interest bills in the past.[vi] French debt service hovered between 10% and 13% of revenues throughout the late 1990s and early 2000s. (Exhibit 3) France fared fine then and we doubt a return to those levels would be any different.[vii]
Exhibit 3: French Central Government Interest Payments Relative to Revenue
Source: Insee, as of 4/9/2026.
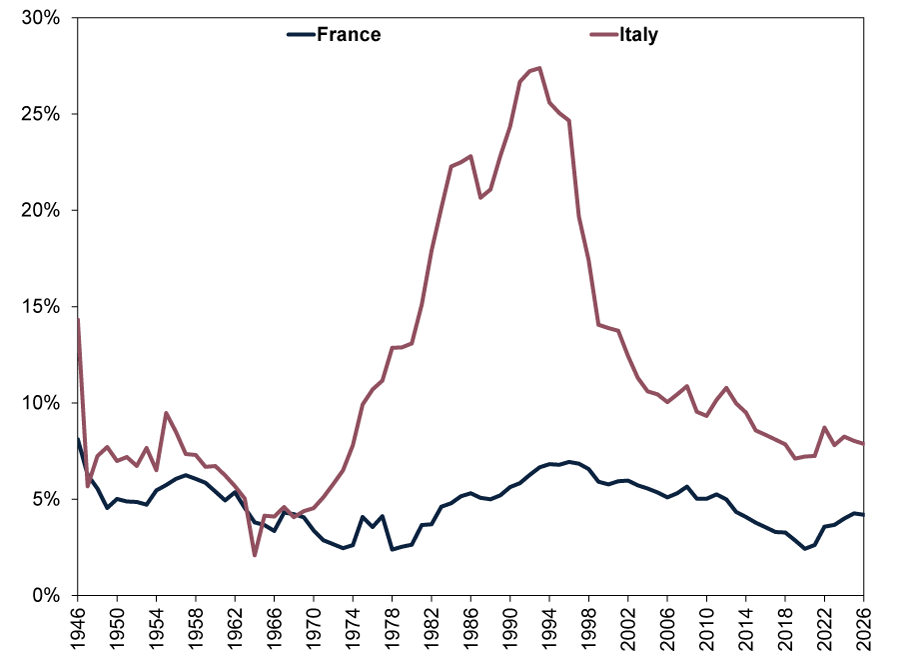
Or look at French general (including state and local) government debt service, which you can compare with Italy’s. (Exhibit 4) France is in finer fiscal fettle than Italy, which we think underscores the role sentiment, rather than fundamentals, is playing lately. Whilst France’s interest coverage has deteriorated slightly, our research shows that isn’t specific to France, but rather part of a global trend as higher market rates filtered through to the debt stock. Regardless, we find austerity isn’t necessary for France’s bondholders to get paid, which is their overriding concern: Government revenues easily cover interest payments.
Exhibit 4: A Longer Look at—and Comparison of—General Government Interest Payments Relative to Revenue
Source: IMF and ECB, as of 4/9/2026. IMF data until 1994, ECB data thereafter. Note last data point for each series is for Q1 2026.
Whilst possible this could change under new administration, in the sense that anything is always possible, we don’t think it is probable. What candidates do—and can accomplish—once in office often strays from what they say on the campaign trail, in our experience. We agree that Mélenchon’s idea could be a disaster if put into practise. But we think the likelihood a Mélenchon-led coalition can push through debt cancelation is minimal. France’s fractured legislature can’t even agree on small fiscal policy tweaks, and this is orders of magnitude bigger, according to our observations.
Still, headlines we see seem to insist a market reign of terror is inevitable—so what say markets? As Exhibit 5 shows, rates in France, like in the rest of the develop world, are up lately but remain at levels economists we follow would consider benign historically. Yes, spreads over Germany are at levels seen in 2012 ... when France didn’t default and wasn’t a focus of the eurozone debt crisis as we witnessed it. So all in all, the uptick looks to us like another sign of bond markets’ return to normal after years and years of skew from monetary policy institutions’ long-term bond purchasing programmes.
Exhibit 5: 10-Year Government Yields—Zoom Out for Perspective
Source: FactSet, as of 4/9/2026.
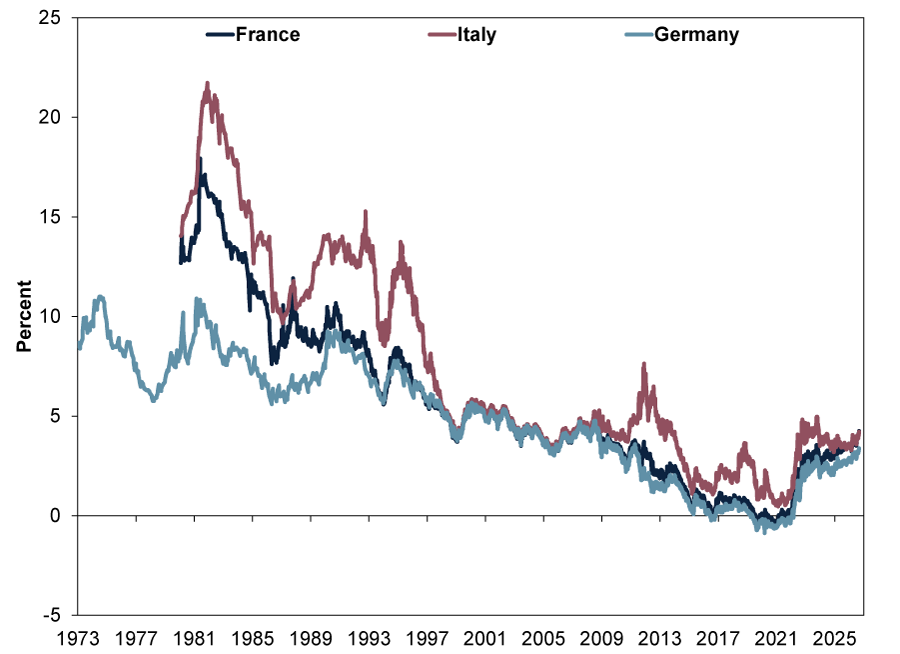
French rates appear to be following global trends, according to our analysis. Their crossover with Italy seems momentous to many commentators we follow. But we think their convergence—again to historically benign rates—speaks more to improving sentiment toward Italy’s finances than warnings over France’s. It looks to us like a sign of Italy’s improved credibility, not France’s sinking. (Note, too, Italy’s 2022 bond scare—like France’s today—didn’t amount to much either based on the evidence we observe.)
Take a step back and we find the alarm many may feel recedes. In our view, reality in France—like the rest of the developed world—isn’t as close to dire straits as whipped-up prognostications we see perceive.
[i] “Hard-Left Presidential Candidate’s Plan to Cancel French Debt Sparks Backlash,” Leigh Thomas, Reuters, 27/8/2026. Accessed via US News and World Report.
[ii] “French Economy Won’t Improve Any Time Soon, Warns Rating Agency,” Eleanor Harmsworth, The Telegraph, 29/8/2026. Accessed via Yahoo!
[iii] “French Borrowing Costs Hit Crisis Levels as Presidential Election Looms,” Chris Price, The Telegraph, 27/8/2026. Accessed via Yahoo!
[iv] Ibid.
[v] Ibid.
[vi] Source: Federal Reserve Bank of St. Louis, as of 4/9/2026. Statement based on federal receipts and interest payments, 1940 – 2026.
[vii] Source: FactSet, as of 4/9/2026. Statement based on GDP growth rates for France in the 1990s and 2000 – 2008.
Get a weekly roundup of our market insights.
Sign up for our weekly e-mail newsletter.

You Imagine Your Future. We Help You Get There.
Are you ready to start your journey to a better financial future?

Markets Are Always Changing—What Can You Do About It?
Get tips for enhancing your strategy, advice for buying and selling and see where we think the market is headed next.
Related Resources
-
Market Analysis Budgeting for French Debt Fears2026-10-06
-
Economics A World Trade Check-In Starring Southeast Asia2026-09-30
-
Politics A September European Political Update2026-09-24
-
Macro Insights Where the Manufacturing Cycle Goes From Here2026-09-23




Contact Us
Learn why 210,000 clients trust Fisher Investments and its affiliates to manage their money and find out how we may be able to help you achieve your financial goals.
As of 30/09/2026. Includes Fisher Investments and its affiliates.
New to Fisher? Call Us.
Contact Us Today