Personal Wealth Management / Economics
America’s Households Are Healthier Than Feared
Consumers’ balance sheets still seem plenty healthy to support consumption.

Faced with better-than-expected April consumer spending growth in a widely watched Bureau of Economic Analysis (BEA) report released Friday, some coverage gravitated to storm clouds supposedly gathering. Their worry is, unsurprisingly, inflation and how it has challenged many households’ finances over the last year and a half. Overall and on average, aggregate consumer spending has held up despite price pressures, suggesting to some that consumers must be heaping on debt, setting up trouble later. But a look at spending, income and household finance data argues otherwise. For investors, the negative attitude toward fine data underscores the prevailing pessimism of disbelief, which fosters young bull markets.
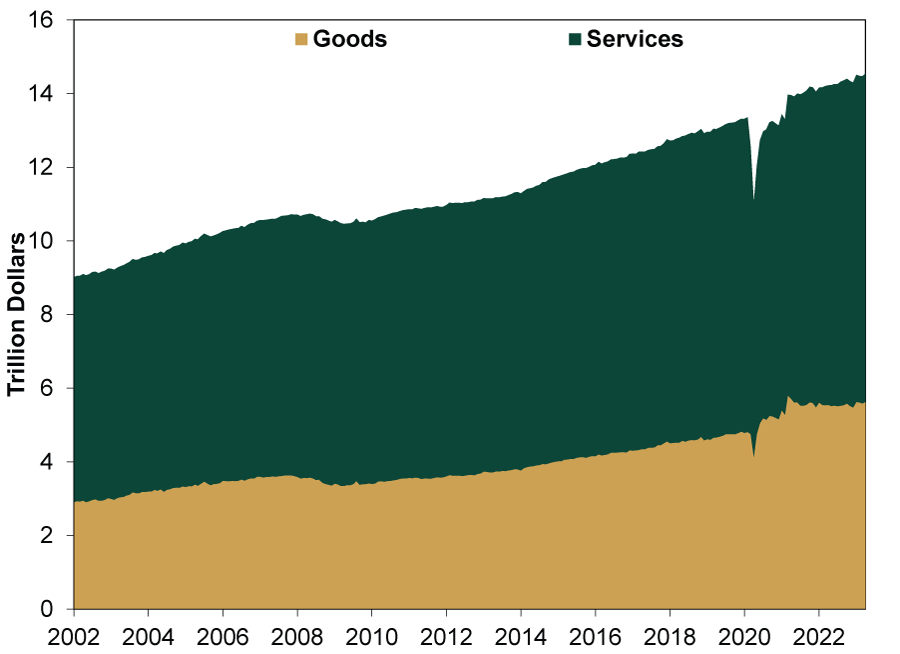
Following a slight -0.2% m/m February dip and flat March, inflation-adjusted or “real” personal consumption expenditures (PCE, the broadest measure of US consumer spending and 71% of GDP) rose 0.5% in April, adding to evidence the economy is off to a good start in Q2. (Exhibit 1) Consumer spending was strong across the board. Services (62% of PCE) not only accelerated to 0.3% m/m growth, but goods expenditures jumped 0.8% after detracting for two months. While backward looking, broad-based expansion in GDP’s main driver suggests recession was likely not at hand in early Q2.
Exhibit 1: PCE Continues Expanding
Source: Federal Reserve Bank of St. Louis, as of 5/26/2023.
That said, April’s personal income rose 0.4% m/m, half the rate of nominal spending.[i] If outlays exceed income for an extended period, that implies consumers are drawing on savings and, some fear, adding debt. This, plus the New York Fed’s Q1 household credit report last week—which showed an uptick in 90-day delinquencies—implies to some observers consumer spending’s growth is on borrowed time.
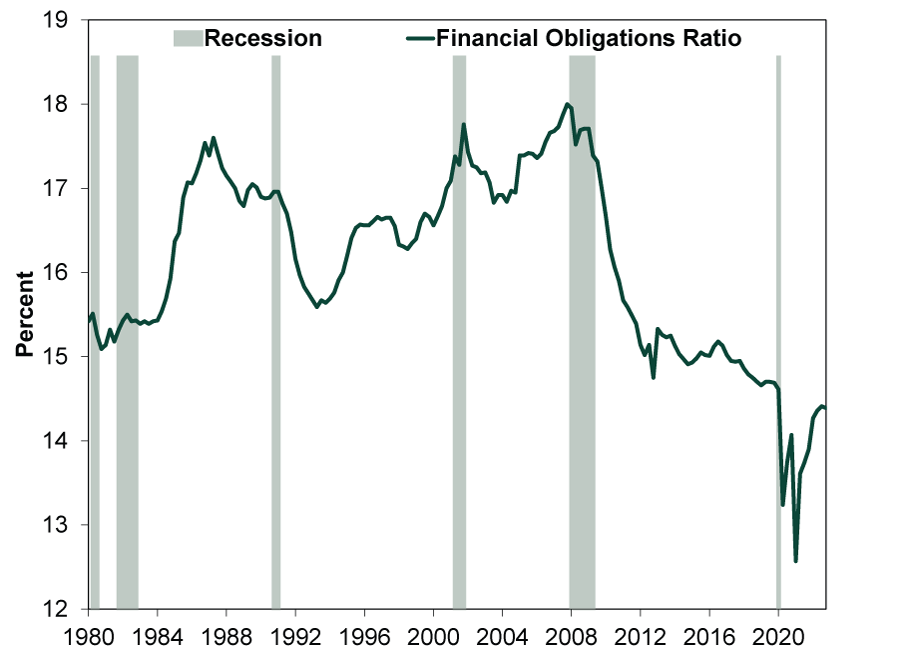
That may sound intuitive—and, potentially, alarming. But we see little evidence to back the narrative consumer debt is crippling demand. For one, households’ financial obligations ratio remains historically low. Americans’ debt service, including rent, property tax and homeowners’ insurance, as a percentage of disposable personal income was just 14.4% in Q4—the latest available data point. (Exhibit 2) This could change in the coming quarters, but for now it remains below any level prepandemic. While aggregate data like this don’t mean individual households aren’t struggling, little here suggests consumers’ nondiscretionary financial obligations are broadly overwhelming their ability to make payments on them—with room to spare.
Exhibit 2: Households’ Financial Load Historically Light
Source: Federal Reserve, as of 5/23/2023. Financial Obligations Ratio, Q1 1980 – Q4 2022.
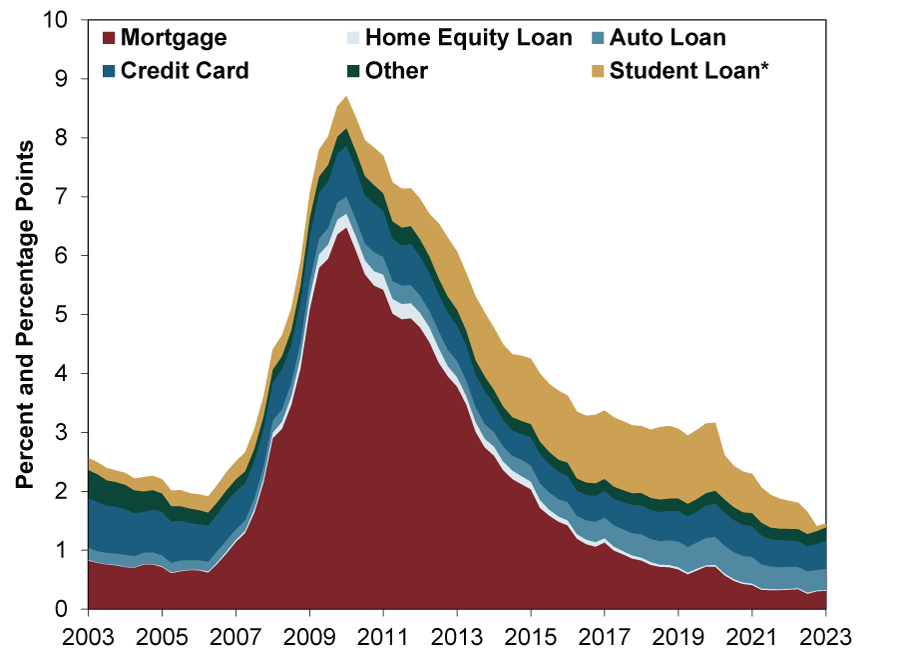
With incomes more than covering financial obligations, it is little wonder household delinquency rates in aggregate are historically low, too. While they did inch up in Q1, they also remain below any point prepandemic, even excluding student loan delinquencies skewed lower by March 2020’s payment moratorium. (Exhibit 3) Now, student loan delinquency rates might rise if the moratorium ends in August, consistent with the draft debt-ceiling deal. But an increase—from effectively zero—wouldn’t be surprising, and outside student lending there is little sign of problems.
Exhibit 3: Household Delinquency Rate Low
Source: Federal Reserve Bank of New York, as of 5/15/2023. Quarterly Report on Household Debt and Credit: Percent of Balance 90+ Days Delinquent by Loan Type, Q1 2003 – Q1 2023. *The US Department of Education has waived federal student loan payments since March 2020.
For the record, the debt-ceiling deal has no bearing on the Biden administration’s plan to forgive $10,000 in student debt for most borrowers, which is being adjudicated in the court system. It may also be worth noting that since 2012, student loan 90-day delinquency rates hovered over 10% until the payment moratorium without triggering a financial crisis—partly because almost 79% of those borrowers owe less than $50,000 and banks have little exposure in any event.[ii] So we aren’t so sure delinquency would spike dramatically whenever the moratorium ends, and even something in the neighborhood of prepandemic rates plus a little bit likely isn’t an enormous macroeconomic headwind.
Of course, households’ health could worsen. But for one, markets would likely signal that way in advance. And two, American household finances seem to be in fine shape now. That many still see otherwise illustrates the wide—and bullish—gap between expectations and reality present today.
If you would like to contact the editors responsible for this article, please message MarketMinder directly.
*The content contained in this article represents only the opinions and viewpoints of the Fisher Investments editorial staff.
Get a weekly roundup of our market insights
Sign up for our weekly e-mail newsletter.

You Imagine Your Future. We Help You Get There.
Are you ready to start your journey to a better financial future?

Where Might the Market Go Next?
Confidently tackle the market’s ups and downs with independent research and analysis that tells you where we think stocks are headed—and why.
Related Resources
-
Economics Q2 US GDP’s Stealthy Strength2026-07-31
-
Expert Commentary This Week in Review | Fed Meeting, US GDP, Eurozone GDP
 2026-07-31
 -
Market Analysis Don’t Fret the EU’s Low Summertime Gas Storage Levels2026-07-31
-
Economics On Fires and GDP2026-07-30


Learn More
Learn why 210,000 clients trust us to manage their money and how Fisher Investments and its affiliates may be able to help you achieve your financial goals.
As of 6/30/2026
New to Fisher? Call Us.
Contact Us Today