Personal Wealth Management / Economics
Higher Education: Putting Student Loan Debt in Perspective
Overall, the debt taken out for a degree isn’t holding back the economy.

As folks enter or return to college this fall, the majority are seemingly paying for it on credit. According to the Fed, through the end of the last school year, 54% of college students took out some form of debt to finance their education.[i] This is part of a growing trend, which many view negatively—not only for the borrowers, but also for the economy. They see student debt triggering a financial crisis or a generation of debt-saddled graduates weighing on economic growth as they postpone marriage, kids and home buying. But as we have explored before, the evidence suggests reality remains rather benign.
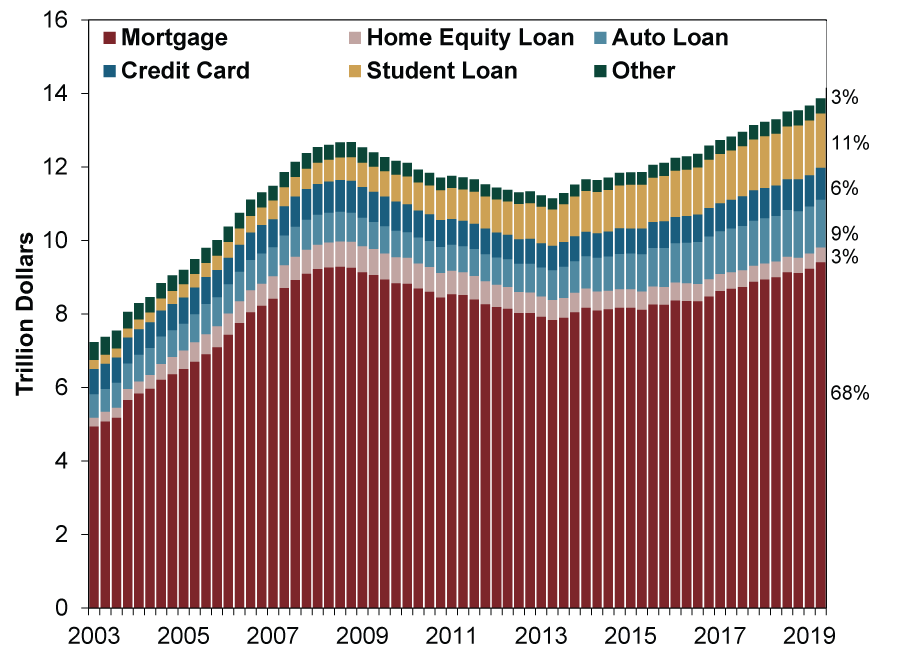
Yes, student loans aren’t small potatoes. While student loans account for only 11% of total US household debt, they have grown from about $240 billion in Q1 2003 to $1.5 trillion in Q2 2019—the fastest-growing consumer debt category. (Exhibit 1)
Exhibit 1: Student Loans Are Only Part of Households’ Debt Picture
Source: Federal Reserve Bank of New York, as of 9/17/2019. Quarterly Report on Household Debt and Credit: Total Debt Balance and its Composition, Q1 2003 – Q2 2019.
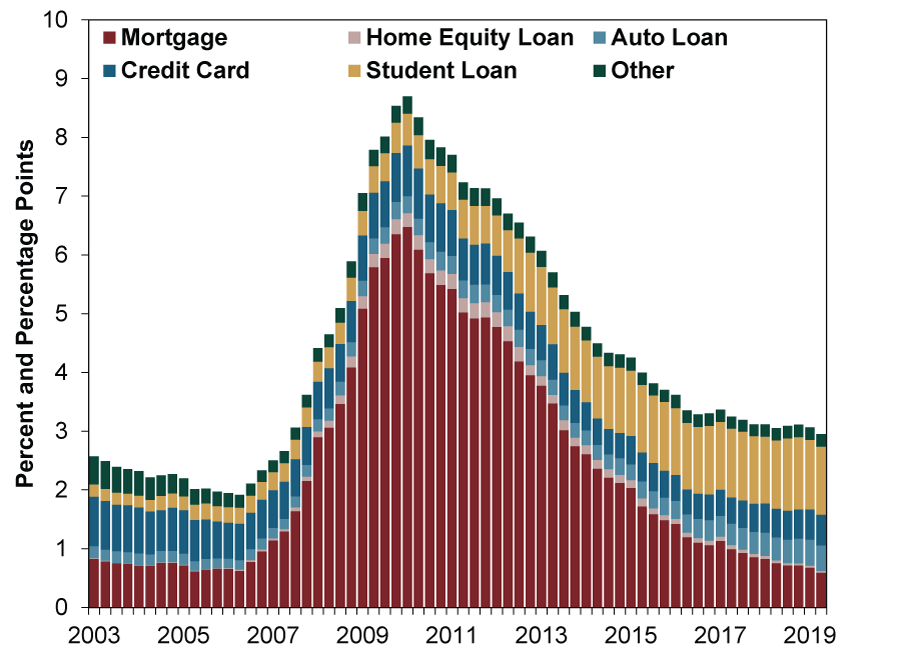
It isn’t the levels that matter for debt sustainability though, but borrowers’ ability to pay. For the most part, they can. The Fed says only 2 in 10 people with outstanding student loans are behind on payments. Now, for those impacted, things can be very difficult. Especially for those struggling with unemployment or other financial problems. We don’t dismiss that. Yet markets tend to look at the big picture. By dollar amounts, about $160 billion of student loans outstanding are 90+ days delinquent—a “seriously delinquent” rate of 10.8%. While this is historically high and above other debt categories, student loan delinquency rates have hovered over 10% since 2012. It isn’t exactly new or surprising, and it hasn’t triggered financial crisis. Further, overall household delinquency rates are falling. As Exhibit 2 shows, the total delinquency rate—less than 3%—is at its lowest since 2007.
Exhibit 2: Households’ Delinquency Rate and Its Composition
Source: Federal Reserve Bank of New York, as of 9/17/2019. Quarterly Report on Household Debt and Credit: Percent of Balance 90+ Days Delinquent by Loan Type, Q1 2003 – Q2 2019.
Another reason student debt-led financial crisis is unlikely: Over 90% of it is owed to the US Department of Education.[ii] Lots of folks seemingly forget the federal government effectively nationalized student lending in 2010. Banks’ exposure to student debt is small. If there were mass defaults, it would be absorbed by the government, not banks or other private financial institutions. As a result, banks wouldn’t have to cut lending elsewhere in order to maintain balance sheets. Nor is there the chance of an extreme reaction—banks failing because of a massive wave of student loan defaults. Because banks are cut out of the equation, the likelihood of a student debt-driven financial crisis is minimal.
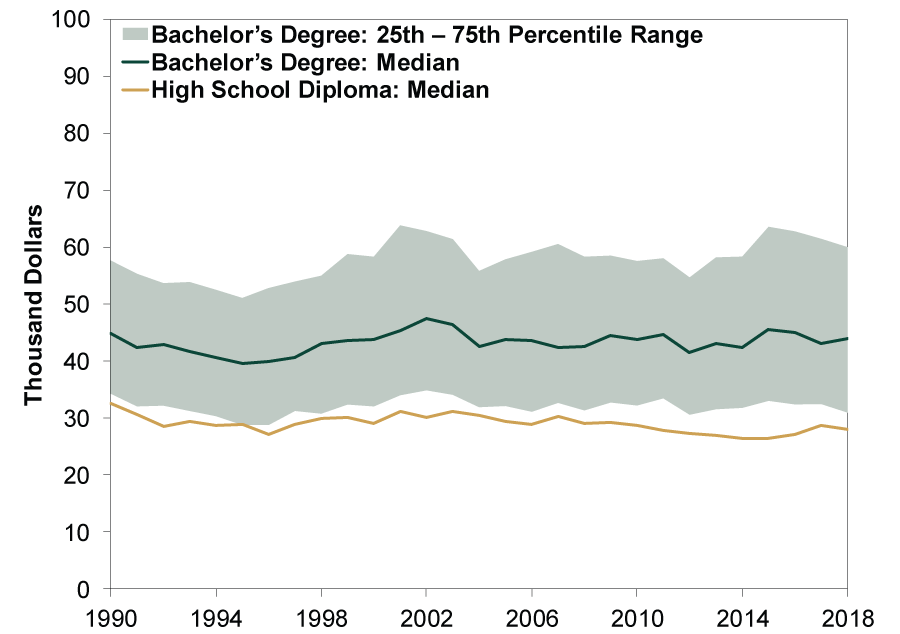
That said, it seems unlikely default rates snowball from here. As the Fed notes, “Perhaps counterintuitively, those with more debt are not more likely to have difficulty with repayments. This is likely to be the case because the level of education, and the associated earning power, generally rise with debt levels.”[iii] College-educated workers’ unemployment rate is about half of the overall rate. (Exhibit 3) It was also dramatically lower when unemployment peaked in 2010, after the last recession. Plus, college graduates’ wages are around 50% higher than those with high school diplomas. (Exhibit 4) It gets better for those with advanced degrees. In 2018, the unemployment rate for workers with graduate school degrees was 2.0%, less than the 2.2% for those with just bachelor’s degrees.[iv] Moreover, advance degree holders’ median earnings were about 26% higher than undergrads.[v] Presuming those with higher loan balances are those with advanced degrees—a reasonable assumption overall and on average—it stands to reason most are probably more creditworthy.
Exhibit 3: Selected Unemployment Rates
Source: Federal Reserve Bank of New York, as of 7/17/2019. “The Labor Market for Recent College Graduates: Unemployment Rates for College Graduates and Other Groups,” January 1990 – June 2019. Note: Rates are calculated as a twelve-month moving average. All workers are those aged 16 to 65; college graduates are those aged 22 to 65 with a bachelor’s degree or higher; recent college graduates are those aged 22 to 27 with a bachelor’s degree or higher; young workers are those aged 22 to 27 without a bachelor’s degree. All figures exclude those currently enrolled in school. Shaded areas indicate recessions as designated by the National Bureau of Economic Research.
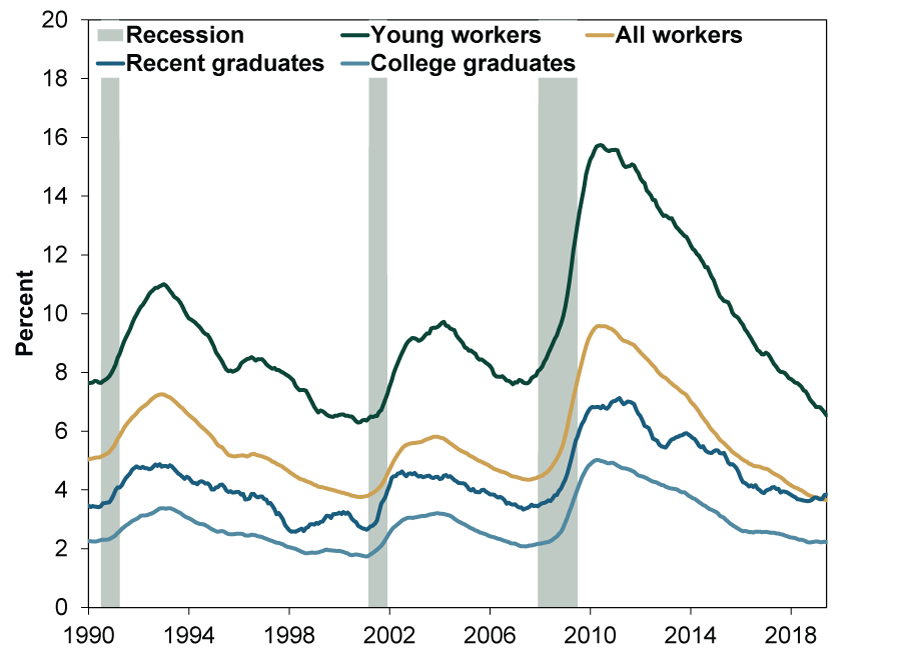
Exhibit 4: Annual Wages for Recent Graduates
Source: Federal Reserve Bank of New York, as of 7/17/2019. “The Labor Market for Recent College Graduates: Distribution of Annual Wages for Recent College Graduates,” 1990 – 2018. Note: Annual wages are expressed in constant 2018 dollars. Recent college graduates are those aged 22 to 27 with a bachelor’s degree only; high school graduates are those aged 22 to 27 with a high school diploma only. Figures are for full-time workers and exclude those currently enrolled in school.
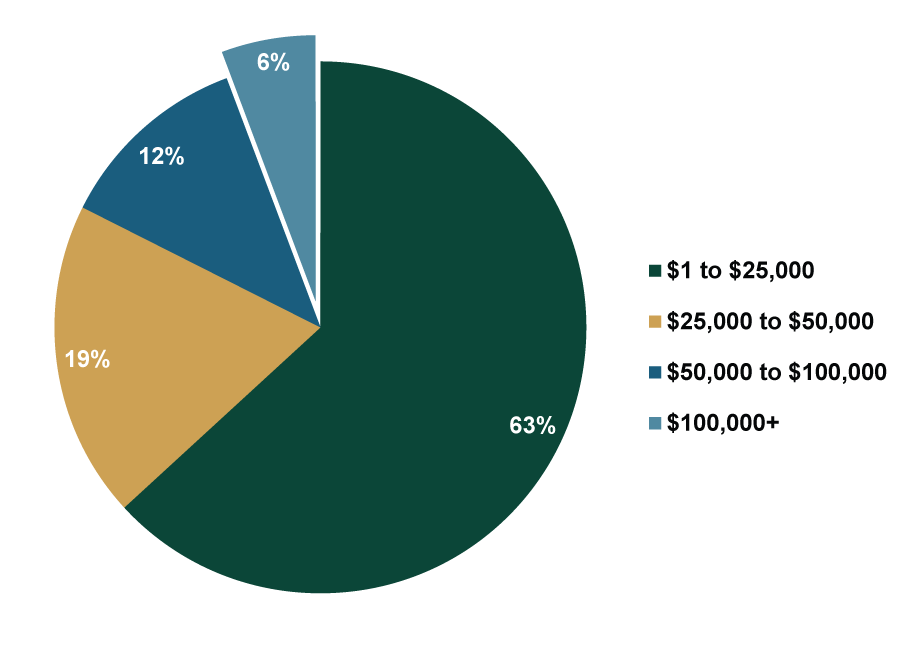
Meanwhile, most student loan balances per borrower aren’t crushing. In 2018, the typical level of student debt outstanding was $20,000 – $25,000, with monthly payments of $200 – $300. That is basically a car payment. Articles about student loan debt often highlight people with six-figure loan balances and trouble repaying. But this is a rarity. As Exhibit 5 shows, those with over $100,000 in student debt represent only 6% of borrowers. Their delinquency rate is just 16%. By comparison, 18% of borrowers with less than $10,000 in debt and 22% with $10,000 – $25,000 of debt were late making payments.
Exhibit 5: Distribution of Student Borrowers by Current Debt Balance
Source: Federal Reserve Bank of New York, 2018 Student Loan Update, as of 9/17/2019. Distribution of Borrowers as of Q4 2017.
As for student loans delaying major life decisions and thereby stunting economic growth, we don’t buy it. Yes, more folks are going to college and seeking advanced degrees. This may delay household formation and homeownership! But the evidence this is permanently crippling the economy is thin. For one, as homeownership rates began to pick up during the last few years, gains were faster among younger generations[vi]—i.e., those supposedly bogged down in student debt. Meanwhile, there isn’t any evidence student loans have deterred spending, whether by renters, homeowners or new parents. Since Q1 2003, quarterly personal consumption expenditures (PCE) growth averaged 1.0% annualized—and 1.1% cutting out the recession.[vii] Following the recession, average PCE growth slowed slightly to 0.9% annualized through mid-2013 as households deleveraged. Since then, though, it has returned to 1.1%.[viii] It is hard to discern any impact on America’s overall consumer spending from ballooning student loans.
While college debt gets a lot of attention—especially, it seems, as 2020 election campaigning heats up—a look at the figures shows the alleged economy-wide student loan “crisis” is mostly academic.
[i] “Report on the Economic Well-Being of U.S. Households in 2018 - May 2019: Student Loans and Other Education Debt,” Staff, Federal Reserve, 5/28/2019. https://www.federalreserve.gov/publications/2019-economic-well-being-of-us-households-in-2018-student-loans-and-other-education-debt.htm
[ii] “2019 Student Loan Debt Statistics,” Teddy Nykiel, NerdWallet, as of 9/20/2019. https://www.nerdwallet.com/blog/loans/student-loans/student-loan-debt/
[iii] See endnote i.
[iv] Source: Bureau of Labor Statistics, as of 9/20/2019. Unemployment rate for the civilian non-institutional population 25 years and over with bachelor’s degree only and advanced degree, 2018. https://www.bls.gov/cps/cpsaat07.htm
[v] Ibid. Median weekly earnings for full-time workers 25 years and over with bachelor’s degree only and advanced degree, Q2 2019. https://www.bls.gov/webapps/legacy/cpswktab5.htm
[vi] Source: US Census Bureau, as of 9/20/2019. Annual homeownership rates by age group, 1982 – 2018. https://www.census.gov/housing/hvs/data/charts/fig07.pdf
[vii] Source: Federal Reserve Bank of St. Louis, as of 9/25/2019. Personal consumption expenditures, Q1 2003 – Q2 2019 and excluding Q1 2008 – Q2 2009 recession. https://fred.stlouisfed.org/series/PCEC
[viii] Ibid. Personal consumption expenditures, Q3 2009 – Q2 2013 and Q3 2013 – Q2 2019.
If you would like to contact the editors responsible for this article, please message MarketMinder directly.
*The content contained in this article represents only the opinions and viewpoints of the Fisher Investments editorial staff.
Get a weekly roundup of our market insights
Sign up for our weekly e-mail newsletter.

You Imagine Your Future. We Help You Get There.
Are you ready to start your journey to a better financial future?

Where Might the Market Go Next?
Confidently tackle the market’s ups and downs with independent research and analysis that tells you where we think stocks are headed—and why.
Related Resources
-
Market Analysis The New Tariffs in Town Are Still Old News2026-07-24
-
Expert Commentary This Week in Review | Market Volatility, Tariffs, SpaceX
 2026-07-24
 -
Economics A Summertime Check-in on US Consumers2026-07-23
-
Expert Commentary Why Ken Fisher Is Optimistic About European Stocks
 2026-07-23


Learn More
Learn why 210,000 clients trust us to manage their money and how Fisher Investments and its affiliates may be able to help you achieve your financial goals.
As of 6/30/2026
New to Fisher? Call Us.
Contact Us Today