Personal Wealth Management / Economics
Chartflation: Five Charts Showing Inflation Isn’t as ‘Sticky’ as Feared
Forward-looking indicators show inflation slowing more.

Despite inflation’s deceleration to half last year’s peak, fears linger. But as we showed last November, leading inflation indicators—which we update here—point toward price pressures easing further. While we don’t think this is a direct market driver, with inflation continuing to weigh on sentiment, the clearing fog likely reveals a better-than-expected reality.
First up, money supply. Over a century of economic theory—and evidence—demonstrates inflation is caused by too much money chasing too few goods and services. Exhibit 1 shows the broadest measure of US money supply (M4, green). We find it tends to lead the US consumer price index (CPI, yellow) by around 12 to 18 months.
Exhibit 1: Money Supply Deceleration Implies Inflation Will, Too
Source: Center for Financial Stability and Federal Reserve Bank of St. Louis, as of 7/3/2022. Divisia M4 (including US Treasurys), January 1968 – April 2023, and CPI, January 1968 – May 2023.
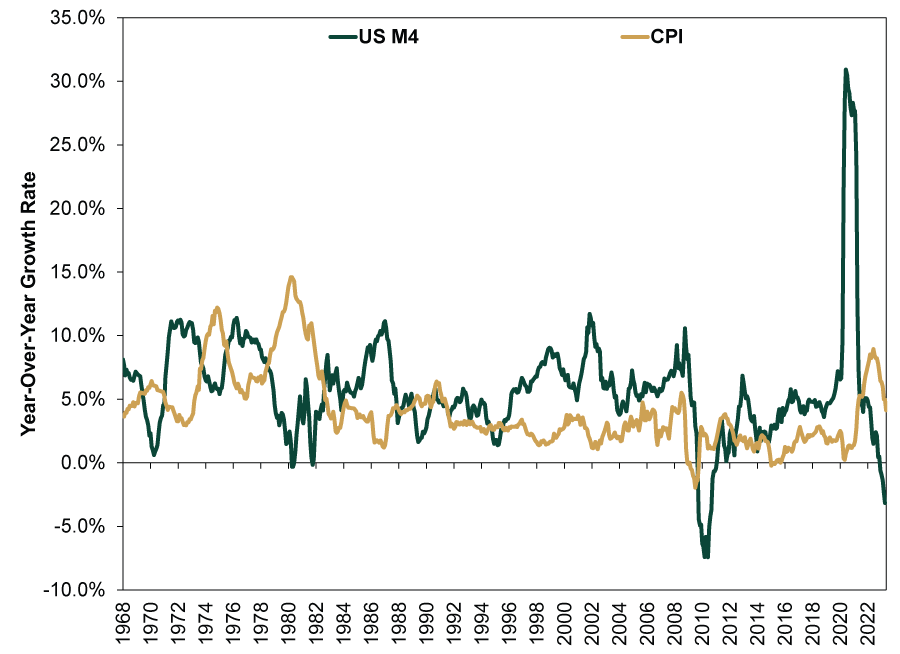
After year-over-year M4 growth peaked at over 30% in June 2020, CPI hit its 9.1% high a year later—as elevated money supply coincided with supply-chain bottlenecks and energy prices’ spike. Money supply has since decelerated sharply and, through April, is down -3.2% y/y, which points to CPI slowing more from May’s 4.0%. Less money to chase goods and services strongly suggests economy-wide prices decelerate further.
That is especially true given supply chain improvements. Exhibit 2 shows supply-chain bottlenecks easing to record lows in May as measured by the New York Fed’s Global Supply Chain Pressure Index (GSCPI). Its spike to record highs last year corresponded with surging inflation as people bid up prices for hard-to-get goods. But with goods once again flowing freely through the global economy, the clamor is subsiding.
Exhibit 2: Global Supply Chain Pressure Easing Helps Relieve Price Pain
Source: Federal Reserve Banks of New York and St. Louis, as of 7/3/2022. Global Supply Chain Pressure Index and CPI, January 1998 – May 2023.
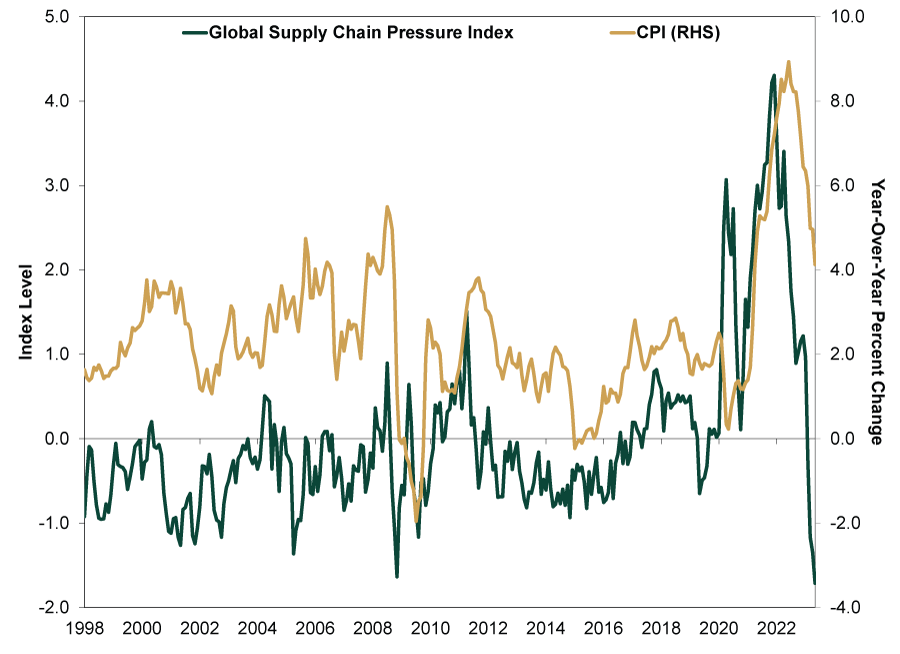
CPI goods inflation was only 0.6% y/y in May, a sea change from its 14.2% peak in March 2022 following Russia’s initial Ukraine onslaught.[i] Core goods inflation, which excludes food and energy, was 2.0% y/y in May.[ii] Now, the GSCPI doesn’t say anything about services, the bulk of the economy, but goods prices look likely to keep tugging inflation down over the foreseeable future.
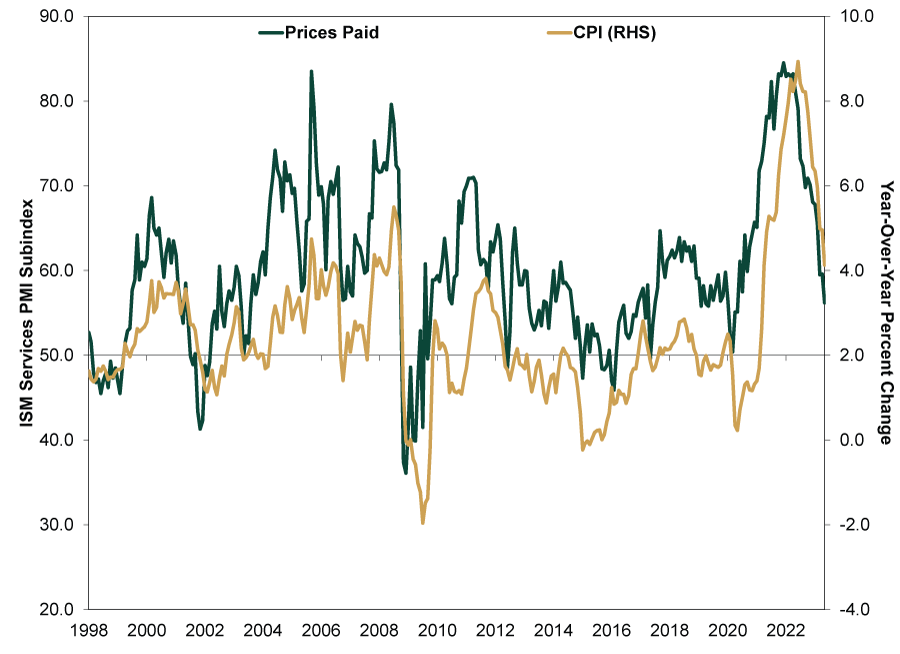
That said, Exhibit 3 shows services prices also look set to moderate more. The prices paid subcomponent in the Institute for Supply Management services purchasing managers’ index (PMI)—representing 71% of US GDP—showed 56.2% of surveyed firms saw their input prices rising in May, a big cooldown from over 80% last year.[iii] Although still a majority, this suggests deceleration in services prices is spreading. It may not be as rapid as goods’, given the demand shift back to services post-reopening, but here, too, even where inflation fear has focused lately, there has been improvement.
Exhibit 3: Services Firms Are Also Seeing Slower Price Growth
Source: FactSet and Federal Reserve Bank of St. Louis, as of 7/3/2023. ISM services purchasing managers’ index (PMI) prices paid subindex and CPI, January 1998 – May 2023.
Meanwhile, markets recognize and reflect dwindling price pressures. Exhibit 3 shows inflation expectations derived from 5-year Treasury and Treasury Inflation-Protected Securities (TIPS) yields are trending lower. Because TIPS’ payouts include the CPI inflation rate (after the fact), many analysts think the difference between those rates and equivalent-maturity regular Treasury yields implies what markets expect inflation to be on average over their respective maturities.
Exhibit 4: The Bond Market Expects Inflation to Moderate
Source: Federal Reserve Bank of St. Louis, as of 7/3/2023. 5-Year Breakeven Inflation Rate, 1/2/2003 – 6/30/2023.
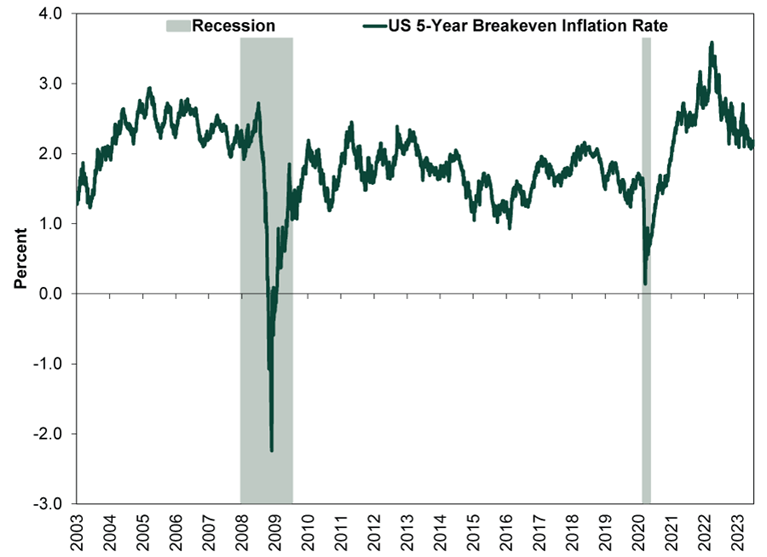
Note, these expectations aren’t predictive. At its March 2022 peak in the immediate aftermath of Russia’s Ukraine invasion, as supply and sanctions disruption fears escalated wildly, so-called “breakeven” inflation expectations over five years hit a record-high 3.6%. This meant bond markets thought inflation would average that in the next five years. Since then, though, the breakeven rate has fallen. Longer-term Treasurys—highly sensitive to inflation—expect annual CPI rates to average around 2.2% now. Market-implied inflation expectations are back into their normal, prepandemic range, belying headline fears.
Lastly, even one of the most “sticky” prices—for shelter—is starting to turn over. While we don’t think this says much about actual shelter costs, it is the biggest part of CPI nevertheless. Shelter makes up over a third of CPI and a subcategory of it—owners’ equivalent rent (OER)—comprises a quarter. OER, though, is based on a survey of homeowners asking them how much they would pay to rent their own house. In our view, this made-up metric—for a good chunk of CPI—has outsized influence, more than it deserves. Moreover, it lags true residential housing costs by a country mile.
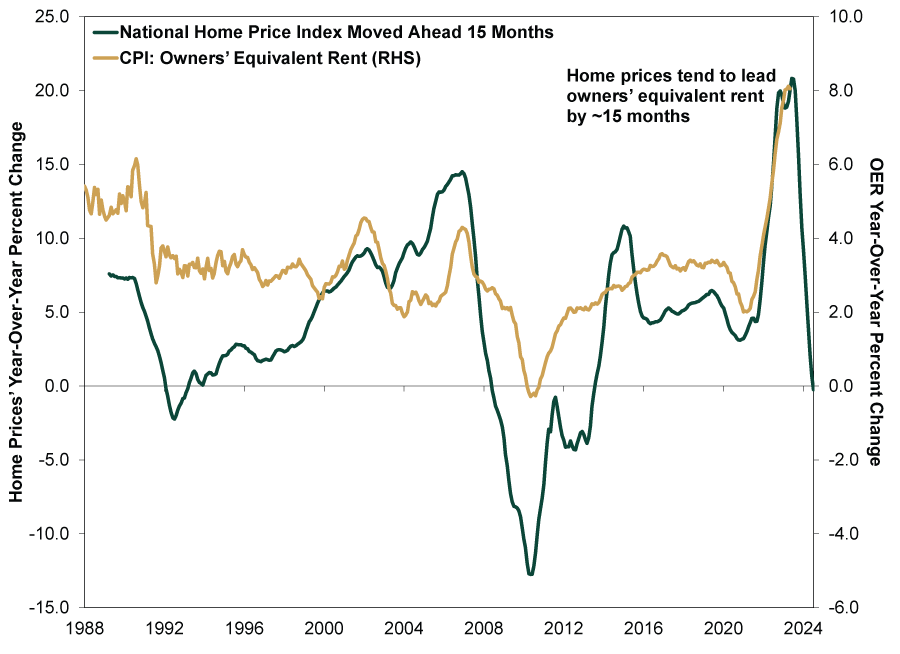
Although OER decelerated in May for the first time since 2020—to 8.0% y/y from April’s 8.1%—Exhibit 5 shows house price deceleration nationally began roughly 15 months ago. With the National Home Price Index declining (fractionally) year-over-year through April, OER is likely to follow. Actual rental rates are also seeing year-over-year declines. May’s national median asking rent ($1,739) fell -0.5% y/y, according to Realtor.com.[iv] This suggests to us OER and shelter costs overall should slow, though perhaps irregularly, from here.
Exhibit 5: Home Price Growth and Rental Rates Starting to Decelerate
Source: FactSet and Federal Reserve Bank of St. Louis, as of 7/3/2023. S&P/Case-Shiller National Home Price Index, January 1988 – April 2023, and CPI: owners’ equivalent rent, January 1988 – May 2023. The Home Price Index is pulled 15 months forward for illustrative purposes.
As we have written before, we don’t expect prices to make a quick round trip to where they were before the pandemic—that would take a historically large deflationary bout. But normalized inflation rates appear much closer to being at hand than most onlookers seem to assume. Leading indicators show inflation fears remain overwrought. That proved to be bullish last fall. We believe it is still bullish now, even if the force of that isn’t as great.
[i] Source: FactSet, as of 7/3/2023. CPI commodities, March 2022 – May 2023.
[ii] Source: FactSet, as of 7/3/2023. CPI commodities less food and energy, May 2023.
[iii] Source: US Bureau of Economic Analysis, as of 6/29/2023. Private services-producing industries as a percent of GDP, Q1 2023.
[iv] “Rent Is Falling in America for the First Time in Years,” Alicia Wallace, CNN, 6/26/2023.
If you would like to contact the editors responsible for this article, please message MarketMinder directly.
*The content contained in this article represents only the opinions and viewpoints of the Fisher Investments editorial staff.
Get a weekly roundup of our market insights
Sign up for our weekly e-mail newsletter.

You Imagine Your Future. We Help You Get There.
Are you ready to start your journey to a better financial future?

Where Might the Market Go Next?
Confidently tackle the market’s ups and downs with independent research and analysis that tells you where we think stocks are headed—and why.
Related Resources
-
Market Analysis The New Tariffs in Town Are Still Old News2026-07-24
-
Expert Commentary This Week in Review | Market Volatility, Tariffs, SpaceX
 2026-07-24
 -
Economics A Summertime Check-in on US Consumers2026-07-23
-
Expert Commentary Why Ken Fisher Is Optimistic About European Stocks
 2026-07-23


Learn More
Learn why 210,000 clients trust us to manage their money and how Fisher Investments and its affiliates may be able to help you achieve your financial goals.
As of 6/30/2026
New to Fisher? Call Us.
Contact Us Today