Personal Wealth Management / Market Analysis
Evaluating Higher Valuations
Stock valuation measures near cyclical highs don’t mean stocks are due for a fall.

2019’s great market returns came despite modestly negative corporate earnings. Hence, stock valuations rose—too far, some fear. In our view, these worries exaggerate how far sentiment has come and mistakenly treat valuation measures as forecasting tools. We think a look at these explains why today’s levels likely don’t portend trouble.
Perhaps the most-cited valuation metric is the forward price-to-earnings (P/E) ratio, which divides stock prices by expected per-share earnings over the next 12 months. People worried about P/Es today focus on the level, comparing it to past points. Seeing that it is high by historical standards, they fear a fall looms. But as we shared recently, we think the rate of change is more important. Sudden spikes or swoons in P/Es can tell you sentiment is reaching extremes. But global P/Es aren’t spiking today. Likewise, US P/Es are only just recovering from the beating they took in 2018, when S&P 500 companies’ earnings grew 20.5% despite stock prices’ falling -4.9%.[i] Zoom out, and US stock valuations are continuing the irregular march upwards they started in 2011.
Exhibit 1: S&P 500 Price-to-Earnings Ratio
Source: FactSet, as of 1/28/2020. S&P 500 12-month forward P/E ratio, 1/2/1996 – 1/27/2020.
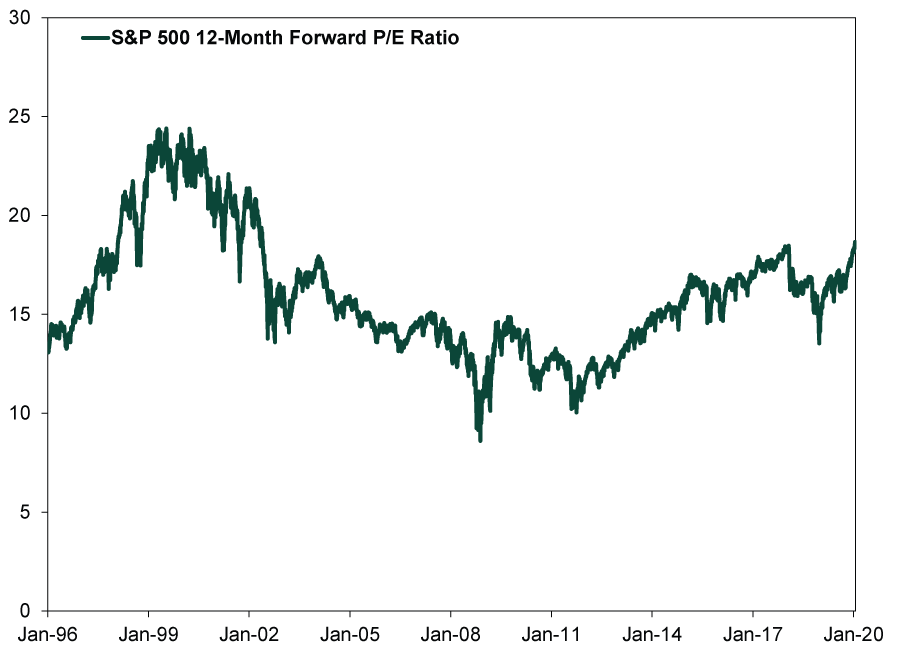
This is consistent with the gradually warming sentiment typical of later-stage bull markets. As investors’ confidence grows, they usually become willing to pay more for a slice of companies’ future earnings. Sentiment can warm—lifting P/Es—for a long time before reaching euphoria. For example, during the 1990s bull, the S&P 500 P/E exceeded present levels on February 4, 1998—and kept rolling for more than two years.[ii]
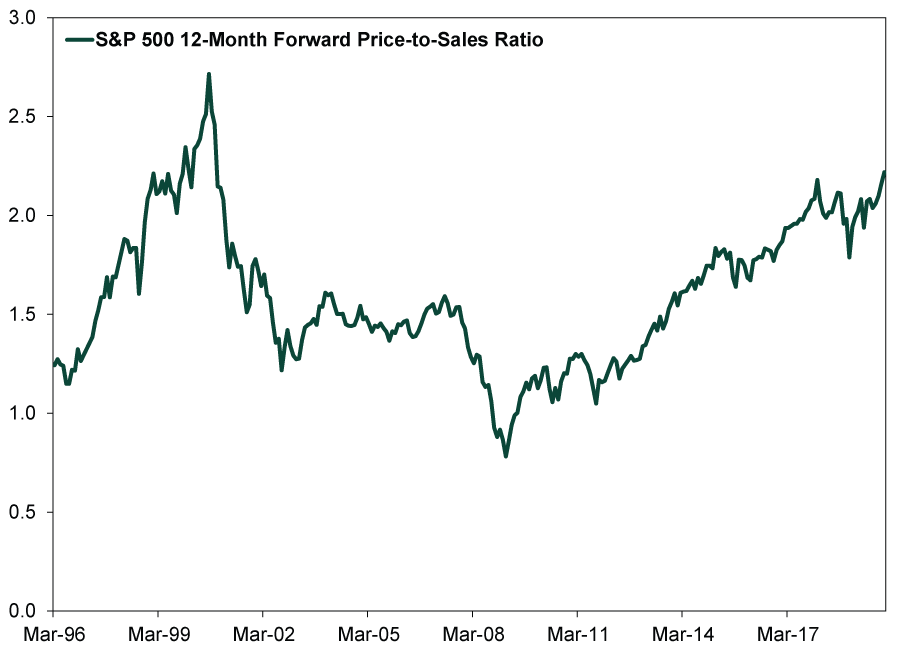
Up next: The forward price-to-sales ratio (PSR), which compares current prices to next year’s expected per-share company revenues. Today it is at its highest point since October 2000. But this, too, means little, considering the PSR shares many of the same drawbacks as P/Es. While it isn’t skewed by one-time costs that can temporarily affect earnings, it still mostly indicates sentiment. Its message matches P/Es’: Sentiment is warmer, but not overly so. To us, recent coverage pointing out the PSR hadn’t topped 2 since the end of the 1990s’ bull simply demonstrates 2007’s market peak lacked euphoria.
Exhibit 2: S&P 500 Price-to-Sales Ratio
Source: FactSet, as of 1/28/2020. S&P 500 12-month forward PSR, monthly, 3/29/1996 – 12/31/2019.
The Cyclically Adjusted P/E ratio, or CAPE, aims to remove the business cycle’s effect on earnings by comparing current prices to the 10-year average of inflation-adjusted earnings. Presently, it is way above its historical average and near highs seen only a few times before in history (the late 1990s and late 1920s).[iii] But we think CAPE is hopelessly flawed and doesn’t even capture sentiment well. Markets look ahead at future earnings, not those from 10 years ago. Inflation-adjusting those earnings—but not stock prices—skews it further.
CAPE spiked in 1929 and 1999 before market crashes, but it has also had many misfires. For example, it has exceeded its historical average for almost all of this bull market. Its creators didn’t even intend it to be a market-timing tool, but instead aimed to forecast returns over the next 10 years. This is an impossible task, in our view, as it requires forecasting stock supply years ahead. Moreover, even if you knew the next decade’s cumulative market returns would be tepid, it wouldn’t be actionable now. Returns could still be great over the next year or five or seven.
One more valuation measure many argue is flashing red: The ratio between S&P 500 market capitalization to US GDP, commonly called the Buffett indicator on account of a certain Nebraskan’s reputed affinity for it.[iv] But there is no reason for GDP—an annual flow of national economic activity—to have a set relationship with market cap, which is a measure of wealth. Especially considering GDP’s calculation quirks. The ratio’s rise could merely reflect publicly traded companies’ growing role in the economy. Plus, many of the S&P 500’s biggest constituents are multinational companies with huge global sales. Yet this indicator effectively compares their entire market cap to a US-specific econometric, which could skew the ratio higher.
Ultimately, valuations are just opinions, aggregated and distilled into numbers—ones anyone can see and pundits dissect regularly. Efficient markets price in common opinions of stocks’ value, sapping valuations’ predictive power.
[i] Sources: Multipl.com and FactSet, as of 1/28/2020. S&P 500 corporate earnings growth in 2019 and S&P 500 Total Return Index, 12/31/2017 – 12/31/2018.
[ii] Source: FactSet, as of 1/28/2020. US 12-month forward price-to-earnings ratio, 2/4/1998 and 1/17/2020.
[iii] Source: Multpl.com, as of 1/28/2020.
[iv] Given Mr. Buffett has stated on the record he “never has an opinion about the market” and doesn’t try to “time” stocks, we suspect he sees a little less in this indicator than legend has some pundits arguing.
If you would like to contact the editors responsible for this article, please message MarketMinder directly.
*The content contained in this article represents only the opinions and viewpoints of the Fisher Investments editorial staff.
Get a weekly roundup of our market insights
Sign up for our weekly e-mail newsletter.

You Imagine Your Future. We Help You Get There.
Are you ready to start your journey to a better financial future?

Where Might the Market Go Next?
Confidently tackle the market’s ups and downs with independent research and analysis that tells you where we think stocks are headed—and why.
Related Resources
-
Market Analysis Why the SOX “Bear Market” Isn’t Foreboding2026-07-21
-
Politics Blunting Burnham?2026-07-21
-
Expert Commentary 3 Things You Need to Know This Week | Q2 Earnings, ECB Meeting, Trump Accounts
 2026-07-20
 -
Weekly Wrap-Up Fisher Investments Reviews: Last Week in Markets—July 13 - July 172026-07-20


Learn More
Learn why 210,000 clients trust us to manage their money and how Fisher Investments and its affiliates may be able to help you achieve your financial goals.
As of 6/30/2026
New to Fisher? Call Us.
Contact Us Today