Personal Wealth Management / Market Analysis
A New Year Sentiment Check-In
Investors are cheerier, but euphoria hasn’t arrived.

A year ago, markets were just a couple weeks removed from stocks’ second-worst December on record. Uncertainty reigned. Investor sentiment was down in the dumps, with many fearing a bear market and recession loomed. We now know that wasn’t the case and, after 2019’s gangbusters returns, sentiment seems more sanguine. But the euphoria that frequently accompanies bull market peaks looks a ways off yet—suggesting to us stocks have further to climb.
Sentiment, on its own, isn’t a leading indicator. But stocks do move on the gap between reality and expectations—a sentiment byproduct. If investors expect disaster, even a mediocre reality is bullish. On the flipside, when investors run out of worries, they may miss big fundamental negatives—a potentially bull-ending combination. But for all its importance, gauging sentiment is more art than science. Surveys trying to capture it aren’t airtight, and actions often speak louder than words. So assessing sentiment requires looking at a range of indicators. In our view, these presently reveal a mixed bag of measured optimism and lingering skepticism.
First up: some surveys. The Conference Board’s consumer confidence gauge hit an 18-year high in October 2018 before retreating some as the Q4 correction struck—logical, as folks’ feelings typically fluctuate with economic and market conditions. It has bounced around that level ever since, indicating US consumers aren’t letting the lengthy expansion get them overly cheerful.
Conversely, the American Association of Individual Investors (AAII) and a Bank of America Merrill Lynch survey highlight two newly bullish groups: individual investors and fund managers. The AAII’s survey showed bears outweighed bulls in 16 of 22 weekly reads from mid-May through mid-October.[i] In the October 11 read, bears outweighed bulls by more than 23 percentage points.[ii] Since then, the gauge has flipped positive, with bulls outweighing bears by a modest amount in every read.[iii] Bank of America Merrill Lynch’s Fund Manager Survey shows a similar pattern. In October, just 31.5% of respondents expected the economy to strengthen over the next 12 months.[iv] By December, 64.5% expected it to strengthen.[v] Funds’ cash balances also dipped to their lowest level since 2013, suggesting more managers expect market gains ahead.[vi]
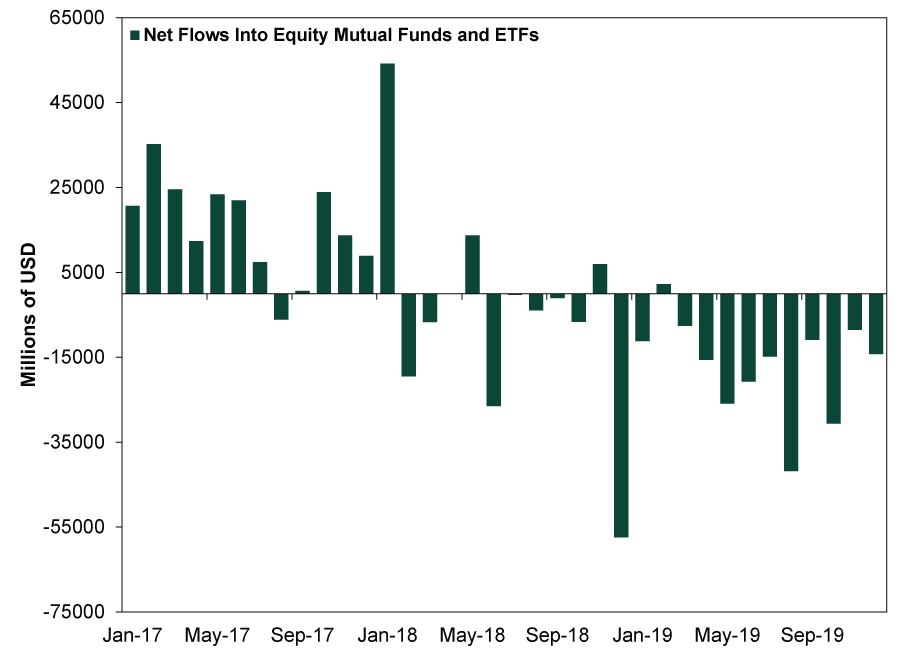
Mutual fund and ETF flows are another sentiment window. While more cash entering stock funds doesn’t show where the money comes from—potentially sales of individual stocks—huge increases in short time periods may reflect excessive optimism. But money mostly left stock funds in 2018 and 2019.
Exhibit 1: Money Mostly Leaving Stock Funds
Source: Investment Company Institute, as of 1/7/2020. Monthly net cash flows into equity mutual funds and ETFs, January 2017 – October 2019. November and December 2019 net flows calculated using weekly fund flow estimates through 12/24/2019.
Up next is margin debt—how much investors are borrowing in their brokerage accounts, potentially to lever up on stock holdings. Spiking margin debt matters far more than absolute levels—and as Fisher Investments Research Analyst Luke Puetz pointed out in a recent column, margin debt is falling today. Since 2017’s close, it is down -12.3%.[vii]
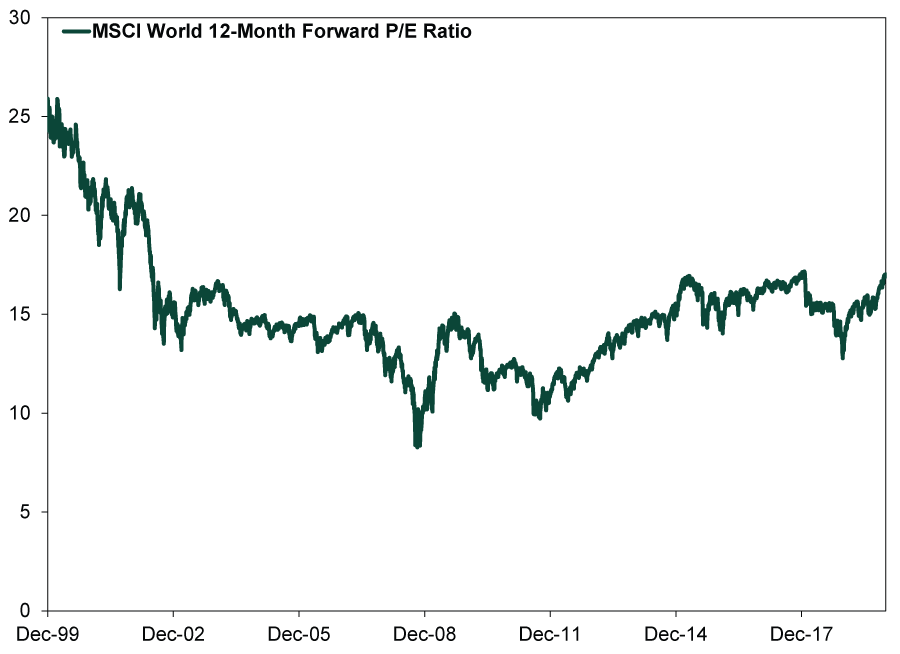
Lastly, stocks’ price-to-earnings (P/E) ratio sheds light on sentiment by showing what investors are willing to pay for a slice of publicly traded companies’ future earnings. Once again, the level isn’t meaningful in itself—expensive markets can get more expensive and cheap markets can get cheaper. But a rapid spike can signal investors are becoming blind to flagging corporate fortunes and might overlook other major threats to stocks—as in the late-1990s Tech bubble, when US valuations surged from 12.5 on September 29, 1995 to 24.4 on March 23, 2000.[viii] The rapid run-up indicated investors were missing negatives like an inverted yield curve, spiking credit spreads and decelerating credit growth. This bearish combo seems absent today. The MSCI World’s P/E ratio isn’t rocketing, and we don’t see investors dismissing sharply deteriorating fundamentals.
Exhibit 2: Global Stock Valuations
Source: FactSet, as of 1/7/2020. MSCI World 12-month forward price-to-earnings (P/E) ratio, 12/31/1999 – 1/6/2019.
None of these indicators mean much in isolation, and they don’t all tell the same tale. It is messy! But were investors growing wildly optimistic, many of these gauges would likely be zooming or reaching extreme levels.
News headlines also offer insight into sentiment’s state. Especially dour coverage reflects and amplifies negative feelings, and vice versa. Presently, we seem to be somewhere in the middle. We see some pundits noting 2019’s great returns while urging caution—or (erroneously, in our view) claiming a partial US/China trade deal and Fed rate cuts temporarily propped up markets. However, we see few warning the bull market or expansion is in immediate danger. Most seemingly anticipate positive returns—lackluster, but positive.
On the whole, euphoria appears distant today, hinting at continued bull market in 2020. But sentiment’s improvement also suggests the gap between reality and expectations is smaller than last year. This means the bar for reality to clear is likely somewhat higher now, raising the probability of lower returns in 2020. We still anticipate a fine year for stocks, but perhaps not a steep climb like we saw in the last 12 months.
[i] Source: FactSet, as of 1/9/2020. AAII Bull/Bear Spread, 5/17/2019 – 10/11/2019.
[ii] Ibid. AAII Bull/Bear Spread, 10/11/2019.
[iii] Ibid. AAII Bull/Bear Spread, 10/18/2019 – 1/3/2020.
[iv] “‘Green Shoots’ Appear Amid Bearish Investor Sentiment: Merrill Survey,” Michael S. Fischer, ThinkAdvisor, 10/15/2019. https://www.thinkadvisor.com/2019/10/15/green-shoots-appear-amid-bearish-investor-sentiment-merrill-survey/
Bank of America Merrill Lynch reports responses in a “net percent” fashion, which subtracts the percentage of respondents expecting weaker growth from the percentage of respondents expecting faster growth. So, they presented this figure as a net 37% of respondents expecting weaker growth.
[v] “Fund managers have turned bullish in a hurry, Bank of America survey finds,” Steve Goldstein, MarketWatch, 12/17/2019. https://www.marketwatch.com/story/fund-managers-have-turned-bullish-in-a-hurry-bank-of-america-survey-finds-2019-12-17
[vi] Ibid.
[vii] Source: FINRA, as of 1/6/2020. Percent change in debit balances in margin accounts between December 2017 and November 2019.
[viii] Source: FactSet, as of 1/9/2020. S&P 500 12-Month Forward P/E Ratio, 9/29/1995 and 3/23/2000.
If you would like to contact the editors responsible for this article, please message MarketMinder directly.
*The content contained in this article represents only the opinions and viewpoints of the Fisher Investments editorial staff.
Get a weekly roundup of our market insights
Sign up for our weekly e-mail newsletter.

You Imagine Your Future. We Help You Get There.
Are you ready to start your journey to a better financial future?

Where Might the Market Go Next?
Confidently tackle the market’s ups and downs with independent research and analysis that tells you where we think stocks are headed—and why.
Related Resources
-
Politics Blunting Burnham?2026-07-21
-
Market Analysis Why the SOX “Bear Market” Isn’t Foreboding2026-07-21
-
Expert Commentary 3 Things You Need to Know This Week | Q2 Earnings, ECB Meeting, Trump Accounts
 2026-07-20
 -
Weekly Wrap-Up Fisher Investments Reviews: Last Week in Markets—July 13 - July 172026-07-20


Learn More
Learn why 210,000 clients trust us to manage their money and how Fisher Investments and its affiliates may be able to help you achieve your financial goals.
As of 6/30/2026
New to Fisher? Call Us.
Contact Us Today