Personal Wealth Management / Market Analysis
From the Mailbag—June 2021 Edition
P/Es and lending and dot plots, oh my!

With summer here and the news cycle a tad slow lately, we took a look into our mailbag for some possible common questions we could address. Among many we found three that seemed ripe: valuations, lending and the Fed’s supposedly “hawkish” turn in June. Without further ado, here they are.
Aren’t stocks overvalued and set to fall? Look at P/Es!
That question, or some variation of it, crops up frequently after stocks have been rising for a spell. This time is no different, as our mailbag is chock full of questions on whether high valuations imply trouble lurks ahead. But as we have written many times, this overrates price-to-earnings ratios’ (P/Es’) predictive power by a longshot. Here is a quick look at why.
To be clear, P/Es are lofty, almost no matter which flavor you pick. The most common ways would be comparing prices to either trailing or estimated forward 12-month earnings. Exhibit 1 shows the S&P 500’s trailing P/E. At 44.7, May 2021’s reading is the highest since September 2009. See? High!
Exhibit 1: S&P 500 Trailing P/Es
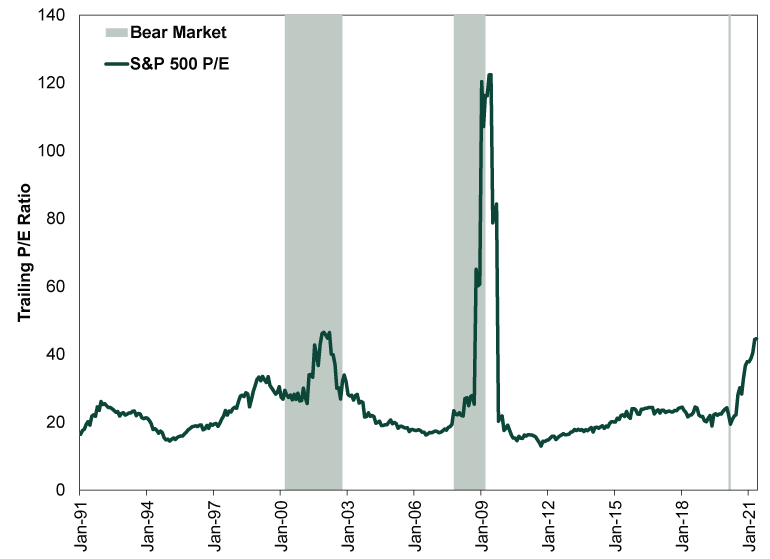
Source: Global Financial Data, Inc., as of 6/23/2021. S&P 500 12-month trailing P/E, January 1991 – May 2021 (latest data available).
But September 2009 was six months into history’s longest bull market. The astronomical P/E then told you exactly zero about markets’ direction. It said more about where earnings had been than anything else. You see, the parabolic spike in P/Es in 2009 stemmed from the fact 2007 – 2009’s financial crisis wreaked even more havoc on earnings than stock prices. As the denominator tumbled, P/Es soared—while the S&P slid in the deepest bear market in the postwar era. They came down later as earnings recovered … while stocks rose. Today, the denominator in trailing earnings includes last year’s lockdown-depressed results, inflating valuations.
Forward P/Es are little better. Since FactSet data start in 1995, the S&P 500’s average forward P/E is 16.2. At 21.2, it is presently well above that and hovering near levels seen in the late 1990s and early 2000s—around the dot-com bubble. But it first reached levels similar to today’s in late 1998—well before the S&P 500 peaked in March 2000. In between, stocks soared. Furthermore, forward P/Es use analysts’ estimates of profits over the next 12 months. Those estimates have proven way, way too low recently. In Q1 2021, 86% of S&P 500 firms beat estimates as earnings soared 52% y/y.[i] Aggregate earnings were a whopping 22.5% above analysts’ consensus estimates. That suggests the P/E’s denominator may be too low, inflating the reading.
Regardless, the key reason why P/Es fail to predict market direction repeatedly is simple: They are core finance theory, taught to virtually anyone interested in investing. Pundits watch them religiously. The data? Accessible virtually anywhere. In our view, something this well understood and widely watched has likely lost any predictive power it may have once had. Pay attention to P/Es if you like, but don’t overrate the message they send.
Why is bank lending so slow? Shouldn’t it be poppin’ in light of that runaway housing market I keep hearing about?
So first of all, bank lending encompasses a lot more than residential real estate. Residential mortgages account for only 21.3% of all outstanding loans as of May’s end.[ii] That puts it behind commercial real estate loans (23.4%) and commercial & industrial loans (24.6%).[iii] Yet we think it is worth dispelling the broader myth that soaring home prices must mean the real estate market itself—and mortgage lending—is rocking. As it happens, mortgage lending finished May about $100 billion below its March 2020 peak—putting it down at levels last seen in December 2017.[iv] Perhaps not coincidentally, existing home sales have fallen four straight months through May and are down -13.8% annualized since last October. Seems to us high prices tied to a lack of supply are discouraging buyers, and new construction is struggling to fill the shortfall in the wake of this spring’s lumber shortage. Now, this isn’t a huge factor for the broader economy or markets—just a reminder that things are often more complex than many think.
But back to the main question, why is lending so weak? Well, the headline number was actually negative from May 2020 – March 2021 for a simple reason: Businesses quickly repaid a big chunk of last year’s pandemic assistance. Most of that assistance channeled from the Fed through commercial banks to small- and medium-sized businesses, so it showed up as a lending spike last March and April, followed by a swift decline. That distortion appears to have worked its way out of the data, and lending now appears in line with its longer-term trend. Exhibit 1 shows this—note the parallel spikes in total and commercial loans, which diverge from the other subcategories.
Exhibit 2: Bank Lending and Major Subcategories

Source: St. Louis Federal Reserve, as of 6/24/2021. Loans and Leases in Bank Credit and selected subcategories for all commercial banks, monthly, January 2010 – May 2021.
Putting that temporary disruption aside, we think slow lending stems from the same headwind that persisted for years before the pandemic and doesn’t appear to be fading soon: the rather flat yield curve. That, of course, is a graphical representation of interest rates ranging from short term to long. A steep curve means the gap between short and long rates is wide—key for banks, which get funding at short-term rates and lend at long-term rates. The difference between the two is a rough proxy for their profit margin on new loans. Those margins have been sad for a long while, which discourages risk-taking and motivates banks to lend to only very creditworthy borrowers, weighing on loan growth overall. That hasn’t been a huge economic headwind considering many iffier companies have easily tapped the bond market to get financing, but it probably does dampen growth to an extent. It probably also weighs on bank earnings from here, in our view, which we think is an underappreciated headwind against Financials stocks.
What about the Fed’s “hawkish” turn at the June meeting?
Another topic we have seen many pixels spilled on in commentary and our editorial inbox: the allegedly “hawkish” turn the Fed took in its June meeting, with many citing the dot plot of interest rate expectations as evidence. Sorry, but this seems like overthinking things, to us.
The dot plot depicts where the 18 current voting and non-voting members of the Federal Open Market Committee (FOMC) see short-term interest rates at the end of this year, the next two years and over the exceedingly nebulous “longer run” based on the information they presently have. Pundits often treat this as the Fed “forecasting” what it will do, or where it intends to take monetary policy over next few years.[v]
In June, no FOMC member foresaw short-term rates exceeding the current 0% – 0.25% by yearend 2021. But 7 saw rates a skosh higher by 2022’s close, up from 4 in March’s dot plot.[vi] By 2023’s end, 13 FOMC members expect rate hikes, with a majority of the committee expecting at least 2 hikes—up from 7 who expected any change in March. This increase led loads of pundits to say a marked change had occurred.
But we have our doubts. For one, the dot plot shouldn’t be taken this literally. Fed members’ opinions change frequently, based both on incoming data and reconsideration of prior statements. Given the volatility in economic data of late, we suspect even Fed members’ confidence in their detailed outlooks for late 2022 and beyond is low.[vii] But also, the voting members of the FOMC will change before 2022’s end. Even Fed head Jerome Powell could be out, if President Joe Biden doesn’t reappoint him. All the potential turnover means guidance today could be quite irrelevant to the people who set policy in 2022 or 2023. It cuts back to a basic point we have made many times: Fed policy can’t be forecast, either by members’ statements or projections. The good news? You don’t need to forecast it, as markets have no preset reaction to Fed moves. It is far more productive to assess actual policy decisions relative to economic conditions when they are made, not years beforehand.
[i] Source: FactSet, as of 6/23/2021. Earnings Insight dated 5/21/2021.
[ii] Source: St. Louis Federal Reserve, as of 6/24/2021. Monthly data used in lieu of weekly for consistency with other lending subcategories.
[iii] Ibid.
[iv] Ibid
[v] And beyond, into that nebulous “longer run” future.
[vi] Source: US Federal Reserve, as of 6/24/2021.
[vii] If it isn’t, it probably should be.
If you would like to contact the editors responsible for this article, please message MarketMinder directly.
*The content contained in this article represents only the opinions and viewpoints of the Fisher Investments editorial staff.
Get a weekly roundup of our market insights
Sign up for our weekly e-mail newsletter.

You Imagine Your Future. We Help You Get There.
Are you ready to start your journey to a better financial future?

Where Might the Market Go Next?
Confidently tackle the market’s ups and downs with independent research and analysis that tells you where we think stocks are headed—and why.
Related Resources
-
Expert Commentary This Week in Review | Fed Meeting, US GDP, Eurozone GDP
 2026-07-31
 -
Economics Q2 US GDP’s Stealthy Strength2026-07-31
-
Market Analysis Don’t Fret the EU’s Low Summertime Gas Storage Levels2026-07-31
-
Economics On Fires and GDP2026-07-30


Learn More
Learn why 210,000 clients trust us to manage their money and how Fisher Investments and its affiliates may be able to help you achieve your financial goals.
As of 6/30/2026
New to Fisher? Call Us.
Contact Us Today