Personal Wealth Management / Economics
Quick Hits on the Latest Inflation and Wage Data
A look at transatlantic price data and US wage growth.

Last week, America and the eurozone announced a spate of price and jobs data—triggering plenty of analysis and discussion about the implications for inflation and future monetary policy. Here we round them up and highlight some tidbits worth considering for investors.
Energy’s Ongoing Impact on Eurozone Inflation
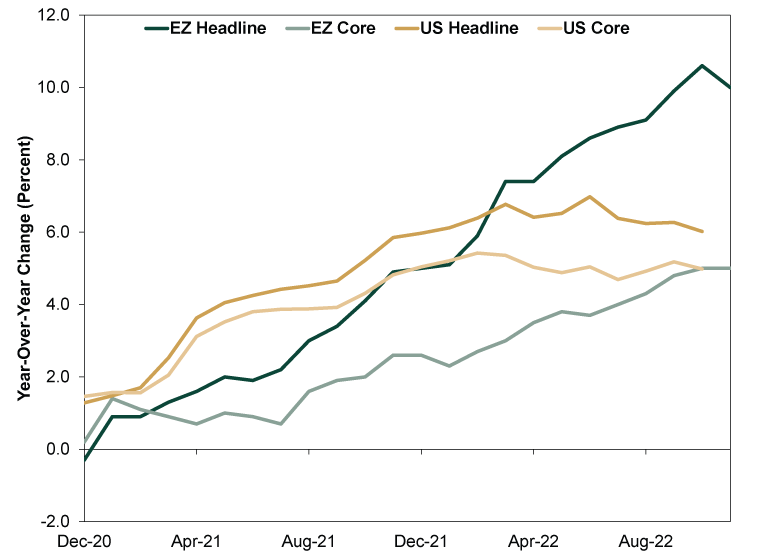
Eurozone inflation slowed for the first time since June 2021, hitting 10.0% y/y in November—below expectations of 10.4% and down from October’s 10.6%.[i] Among the main components, energy and services prices grew more slowly—easing from October’s 41.5% y/y to 34.9% and 4.3% to 4.2%, respectively—while the food, alcohol & tobacco category sped (from 13.1% to 13.6%).[ii] Core inflation (which excludes volatile energy, food, alcohol & tobacco prices) registered 5.0%, unchanged from October.[iii]
Many experts read into the headline slowdown, positing eurozone inflation has perhaps peaked. That could be! But we caution investors against reading too much into one month of data, as trying to pinpoint exact inflection points is fruitless. Moreover, the eurozone faces some unique issues impacting inflation data. Even though oil prices have been overall falling since March, helping cool inflation in the US and elsewhere, that hasn’t been the case in the eurozone due to its reliance on natural gas. (Exhibit 1) Prices have been elevated on supply concerns as EU nations raced to fill reserves, and with the winter heating season approaching, those pressures will probably take more time to ease—though we suspect they eventually will. And make no mistake—energy is the core (ha) issue in Europe. Its fast rise is largely why headline prices are doubling the inflation rate in prices excluding energy, food and tobacco. (Exhibit 2)
Exhibit 1: Comparing Eurozone and US Energy Prices
Source: FactSet, as of 12/5/2022. Eurozone HICP for Energy, December 2020 – November 2022, and US PCE Energy Goods & Services Price Index, December 2020 – October 2022.
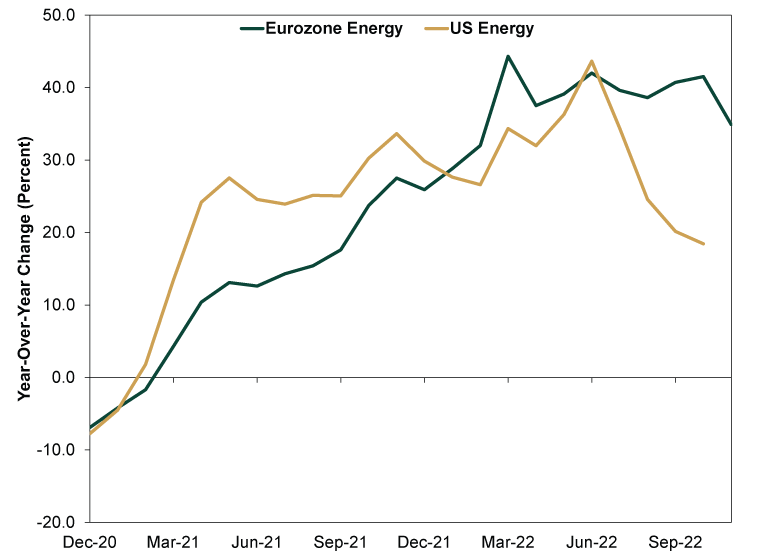
Exhibit 2: Energy Drives the Gap in Eurozone Headline Inflation
Source: FactSet, as of 12/7/2022. Eurozone HICP and Core HICP, December 2020 – November 2022, and US PCE and Core PCE Price Indexes, December 2020 – October 2022.
Americans Spend Even as Prices Rise
On this side of the pond, America’s personal consumption expenditures (PCE) price index—the Fed’s preferred inflation measure—ticked down to 6.0% y/y in October from September’s 6.3%, while core prices (which exclude food and energy) decelerated to 5.0% from 5.2%.[iv] Looking under the hood, goods prices rose 7.2% y/y, decelerating from September’s 8.0%, while services prices ticked up to 5.4% from 5.3%.[v] The former appears to be easing as supply chain bottlenecks work themselves out and producers increase supply in response to higher prices. But some worry rising services prices will offset the slowdown in goods prices as issues, including labor shortages, lead to higher costs for services industries. In our view, the rise in services prices reflects some pent-up demand tied to easing COVID measures and businesses’ getting back to normal operations. But just as goods prices have started easing as supply and demand came into better balance, we expect to see something similar on the services side as businesses and workers adjust.
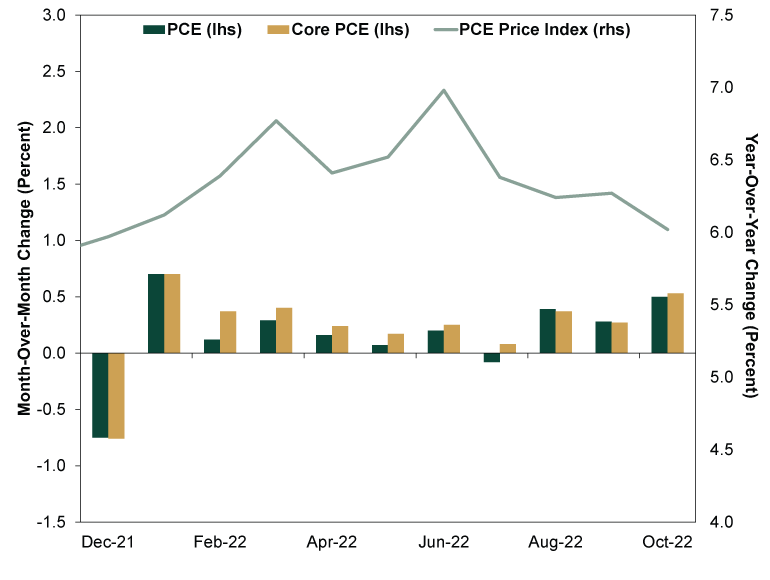
October’s PCE report also shed some light on a widespread fear from this year: Will high prices crimp consumers? Headlines feature plenty of anecdotal evidence highlighting inflation’s toll on households’ pocketbooks, and that is no doubt true for some. But overall spending has been resilient. Inflation-adjusted PCE rose 0.5% m/m, as consumption in goods and services each rose. (Exhibit 3)
Exhibit 3: Resilient US Consumer Spending
Source: FactSet, as of 12/5/2022. December 2021 – October 2022. Core PCE excludes food and fuel.
Even though prices have risen, disposable incomes have kept pace—a big reason spending has remained resilient even as headline inflation has accelerated.[vi] As the annual inflation rate moderates, monthly price increases probably level off, too, which may be underway. Consider: After averaging a monthly change of 0.5% from January 2021 – June 2022, PCE prices have been slowing, registering a 0.3% m/m rate in September and October—in line with the long-term historical average of 0.3% from 1960 – 2019.[vii] In our view, people can continue managing at that moderating rate, especially as businesses adjust wages and salaries for inflation—which usually happens at a lag.
One recent argument we have seen: Households are racking up debt (namely, credit card debt) to support their spending, which will lead to future problems. But as we covered last month, US household balance sheets overall are in better shape than many appreciate. While credit card balances have been rising, New York Fed research shows delinquency rates remain low despite some recent upticks—suggesting consumers are using their savings to help manage their finances.[viii] It is possible that changes, but household debt doesn’t appear to be a pressing issue today.
What to Make of Hot US Wage Growth
Last Friday’s November unemployment report showed nonfarm payrolls rose again, this time by 263,000, while the unemployment rate remained a historically low 3.7%.[ix] But the figure that caught most eyeballs: ongoing hot wage growth. Hourly earnings rose 0.6% m/m (5.1% y/y), its biggest gain since January.[x] Some worry this could herald a wage-price spiral, in which tight labor markets force employers to pay more to workers, boosting demand. They then pass on increased labor costs to consumers, stoking yet more inflation—lather, rinse, repeat. In turn, the Fed may decide to continue hiking interest rates, raising the risk of recession.
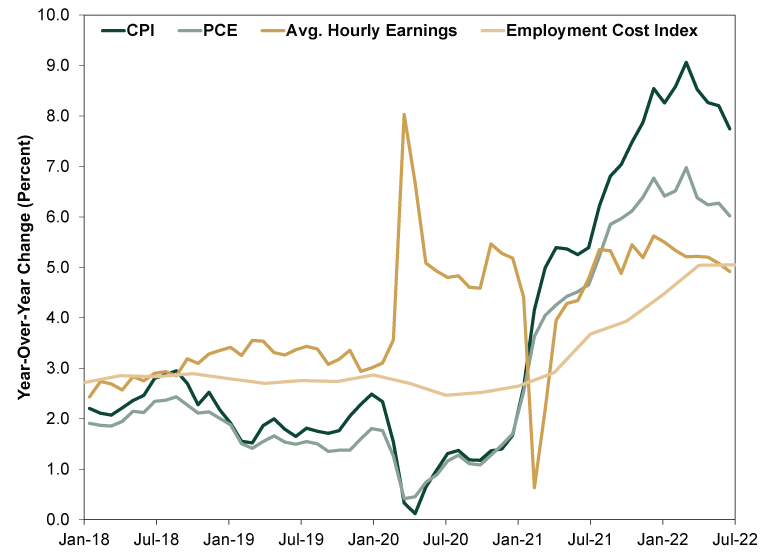
Now, there are many misperceptions with this line of thinking, in our view. For one, Fed officials’ decisions aren’t predictable—not to mention rate hikes don’t have any preset market or economic impact. But the wage-price spiral is also faulty logic. As Nobel laureate Milton Friedman taught in the 1960s, inflation drives wage growth, not the other way around. Wages are simply a price (in this case, of labor). As inflation rises, some workers may demand a raise to account for the loss of spending power. But while employers could pass on those pay increases to customers if they think market forces will allow it, they don’t have to. Companies may also adjust operations to offset their higher labor costs. Or, they could use their gross margins and absorb the hit on the expectation that future growth will make it up.
This isn’t just theory, as Exhibits 4 and 5 show. If higher wages are an inflation driver, they should lead inflation measures—and that isn’t the case.
Exhibit 4: Wages Don’t Drive Inflation
Source: FactSet and Federal Reserve Bank of Atlanta’s Wage Growth Tracker, as of 12/5/2022. CPI – All Items Index, PCE Price Index, and Atlanta Wage Growth Tracker, March 1997 – October 2022.
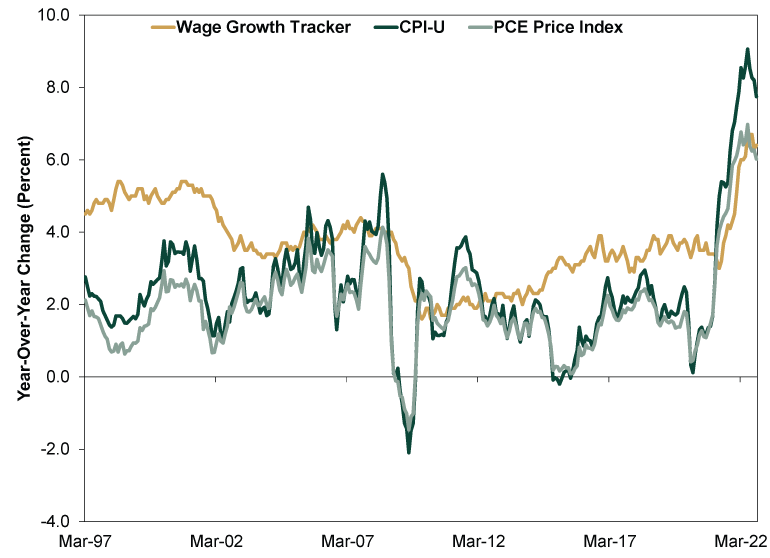
Exhibit 5: More Evidence Wages Don’t Drive Inflation
Source: St. Louis Federal Reserve, as of 12/2/2022. Consumer Price Index – All Items, Real PCE Price Index, Average Hourly Earnings of All Employees, November 2017 – October 2022, and Employment Cost Index: Total Compensation, Q3 2017 – Q2 2022.
[i] Source: FactSet, as of 12/5/2022.
[ii] Ibid.
[iii] Ibid.
[iv] Ibid.
[v] Ibid.
[vi] Source: St. Louis Federal Reserve, as of 12/7/2022. Statement based on real per-capita disposable personal income, monthly, January 2010 – October 2022.
[vii] See note i. Statement based on PCE Price Index, month-over-month change, January 1960 – December 2019.
[viii] “Balances Are on the Rise—So Who Is Taking on More Credit Card Debt?” Andrew Haughwout, Donghoon Lee, Daniel Mangrum, Joelle Scally, and Wilbert van der Klaauw, Liberty Street Economies, 11/15/2022.
[ix] See note i.
[x] Ibid.
If you would like to contact the editors responsible for this article, please message MarketMinder directly.
*The content contained in this article represents only the opinions and viewpoints of the Fisher Investments editorial staff.
Get a weekly roundup of our market insights
Sign up for our weekly e-mail newsletter.

You Imagine Your Future. We Help You Get There.
Are you ready to start your journey to a better financial future?

Where Might the Market Go Next?
Confidently tackle the market’s ups and downs with independent research and analysis that tells you where we think stocks are headed—and why.
Related Resources
-
Economics Quick Hit: Durably Broad-Based Growth2026-07-29
-
Market Analysis On the Chop in the Oil Market2026-07-29
-
In The News Why Kevin Warsh should think twice about hiking interest rates — even as anxiety over the Iran war grows2026-07-27
-
Expert Commentary 3 Things You Need to Know This Week | Fed Meeting, US Q2 GDP, Eurozone Inflation
 2026-07-27


Learn More
Learn why 210,000 clients trust us to manage their money and how Fisher Investments and its affiliates may be able to help you achieve your financial goals.
As of 6/30/2026
New to Fisher? Call Us.
Contact Us Today