Personal Wealth Management / Economics
Checking In on US Household Financial Health
Credit card debt is up. What does that mean?

Whenever a negative or perceived negative arises, you can count on investors hunting far and wide for signs of real trouble. So it has gone this year with inflation and household finances. Undoubtedly, inflation has been a burden for many, stretching budgets and forcing some people and families to make tough decisions. Yet on the macroeconomic front, there isn’t much sign of major trouble yet. Consumer spending is still growing, even adjusted for inflation, albeit slowly. Wages are rising, maybe not as much as inflation, but they are up. Hence, the hunt for the signs of deeper trouble finally arriving. This week, the hunt centered on consumer debt—specifically credit card debt, which the latest reports estimate could hit $1 trillion by yearend. This allegedly signals that cash-strapped households are borrowing to make ends meet, storing up trouble for later. However, when we take a broader look at household balance sheets, we think this observation falls flat as an economic risk.
One of the most common pitfalls in assessing data is viewing debt in absolute terms—the amount outstanding—and getting hung up on the big numbers. Those numbers are usually meaningless, as debt is just one part of a balance sheet. Think about a middle-American household with a car loan and a mortgage. This hypothetical family may have $400,000 in debt. But they also have assets: the house, car, savings accounts, retirement accounts and investment accounts. And they don’t have to repay the debt all at once. Income, perhaps combined with assets, enables these folks to handle the debt.
So rather than looking at credit card debt in a vacuum, we think it makes more sense to view it as one ingredient of households’ broader finances. One way to do that: compare it to total financial assets. Exhibit 1 does this, using the Fed’s quarterly data since 1995, when granular data on household credit card debt begins. As you will see, while credit card debt is up lately, it has more than halved since the 1990s and finished Q2 below 1.0% of total assets—and even this overstates matters a bit, as it compares the combined credit card debt of households and nonprofits, which is the most granular measure available, to the total financial assets of households only. Even if you add in the roughly $40 billion in credit card debt that separate Fed data show the country has taken on this year, it isn’t enough to move the needle. If the US economy and consumer spending could grow just fine at higher credit card debt ratios in the past, we doubt the present uptick is problematic.
Exhibit 1: A Proper Look at Household Credit Card Debt
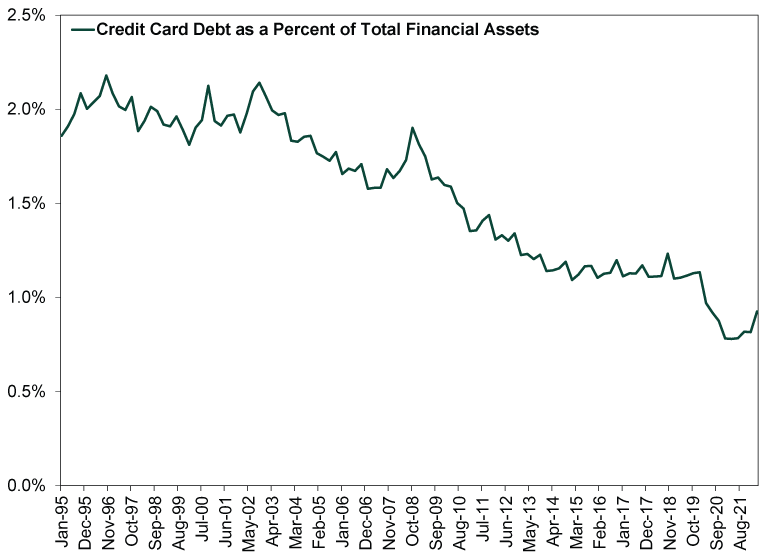
Source: St. Louis Federal Reserve, as of 11/8/2022. Total financial assets of US households and total credit card debt of US households and nonprofits, quarterly, Q1 1995 – Q2 2022.
In our view, credit card debt levels don’t indicate consumers’ overall spending prowess. More relevant: disposable income. Exhibit 2 shows this on an inflation-adjusted, per-capita basis. The past two and a half years are quite noisy due to pandemic assistance programs’ distortions. But if you look past that, you will see that even once you adjust disposable income for inflation and population growth, it is in line with pre-pandemic levels. Yes, it has been flattish this year as pay has struggled to match inflation, but this is pretty normal. Nobel laureate Milton Friedman showed decades ago that wage growth normally lags inflation. Companies often need time to make sure inflation is sticky enough to justify raising pay—and to boost revenues enough to be able to afford it. Eventually they can catch up, but in the meantime, workers still seem pretty flush overall.
Exhibit 2: A Proper Look at Households’ Spending Power
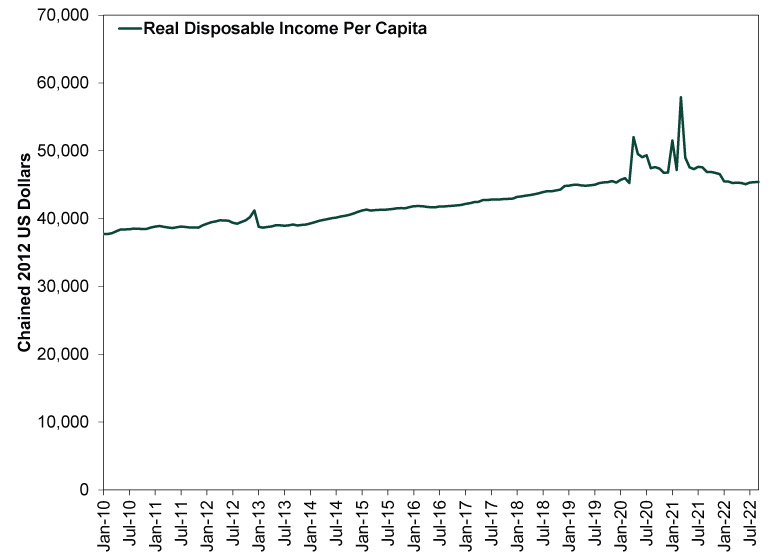
Source: St. Louis Federal Reserve, as of 11/8/2022. Real per-capita disposable personal income, monthly, January 2010 – September 2022.
Now, none of this is to say that every American household is in ship-shape. Some are feeling a very hard pinch. Some are struggling to make ends meet. But that is always the case, unfortunately, and stocks—and broader economic growth—are very good at seeing past this, in our view. What matters to these cold-hearted beasts is whether the country overall can continue spending and investing, and the broad data suggest households en masse can do just that.
If you would like to contact the editors responsible for this article, please message MarketMinder directly.
*The content contained in this article represents only the opinions and viewpoints of the Fisher Investments editorial staff.
Get a weekly roundup of our market insights
Sign up for our weekly e-mail newsletter.

You Imagine Your Future. We Help You Get There.
Are you ready to start your journey to a better financial future?

Where Might the Market Go Next?
Confidently tackle the market’s ups and downs with independent research and analysis that tells you where we think stocks are headed—and why.
Related Resources
-
Economics Quick Hit: Durably Broad-Based Growth2026-07-29
-
Market Analysis On the Chop in the Oil Market2026-07-29
-
In The News Why Kevin Warsh should think twice about hiking interest rates — even as anxiety over the Iran war grows2026-07-27
-
Expert Commentary 3 Things You Need to Know This Week | Fed Meeting, US Q2 GDP, Eurozone Inflation
 2026-07-27


Learn More
Learn why 210,000 clients trust us to manage their money and how Fisher Investments and its affiliates may be able to help you achieve your financial goals.
As of 6/30/2026
New to Fisher? Call Us.
Contact Us Today