Personal Wealth Management / Market Analysis
Scaling Tariffs and Reviewing History
When put in proper context, the pending steel and aluminum tariffs likely have much less bite than most fear.

Five days after President Trump announced plans to slap global tariffs on steel (25%) and aluminum (10%) imports, trade war fears haven’t quieted. When assessing any policy’s potential market impact, it is important to put the changes in context. Scaling these tariffs and examining the history of the world’s last big trade war shows the forthcoming tariffs, on their own, should lack the size and scope to derail this bull market and economic expansion.
The last trade war occurred when trading partners reacted to the Tariff Act of 1930 (aka Smoot-Hawley). Unlike the steel and aluminum tariffs, Smoot-Hawley didn’t target a few niche industries. Rather, it raised tariffs across the entire US economy. Exhibit 1 shows US duties collected as a share of total US imports for consumption. With Smoot-Hawley, US duties jumped from 13.7% to 19.8%. Today, US duties are 1.5% of total imports for consumption.
Exhibit 1: US Duties Collected Relative to Imports for Consumption
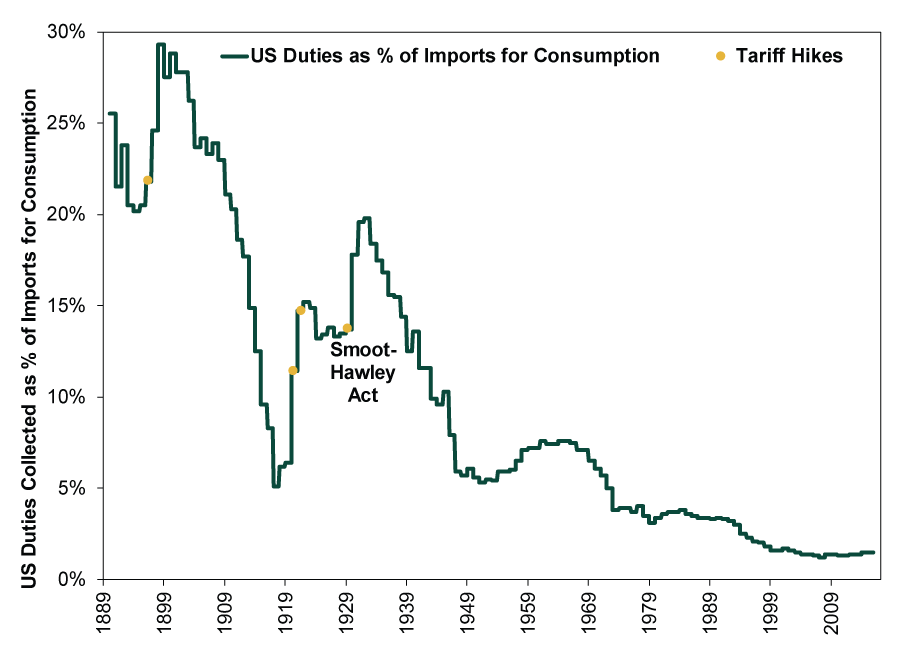
Source: US International Trade Commission, as of 3/2/2018.
The new tariffs shouldn’t increase this much. Steel and aluminum’s combined share of total US imports is less than 1.5%. With a 25% tariff on steel and a 10% tariff on aluminum, the duties as a percentage of total US imports for consumption would rise from the current 1.5% to no more than 1.8%. The 6.1 percentage point jump with Smoot-Hawley was about 20 times larger.
While many associate Smoot-Hawley blowback with the 1929 – 1932 bear market, protectionism didn’t directly cause that downturn—it probably compounded it, but there were other causal features. A deeply inverted yield curve and euphoric markets—both bearish signs—preceded the bear market. Even years after the bear market began, monetary policy remained far too tight, as Milton Friedman explained in his seminal work, A Monetary History of the United States. Since major economies were still on the gold standard, central banks had to tighten monetary policy to defend gold reserves during the recession. The result was a severe monetary contraction at a time when liquidity was vital.
While many seem to accept that steel and aluminum tariffs aren’t analogous with Smoot-Hawley, multiple observers have tried to draw parallels with President Bush’s steel tariffs, noting the market’s sharp selloff after he implemented the tariffs in 2002. But correlation isn’t causation. There was a lot going on besides steel tariffs, as shown in Exhibit 2. The WorldCom bankruptcy and Sarbanes-Oxley followed four months after the tariffs. Moreover, the US economy did not fall back into recession—as you might expect if tariffs were derailing the economy—even though the market declined sharply. While economists believe the tariffs did result in about 200,000 job losses—a scenario many believe could repeat now—this isn’t on par with a full-blown recession.
Exhibit 2: US Markets and Events Surrounding the 2002 Steel Tariffs
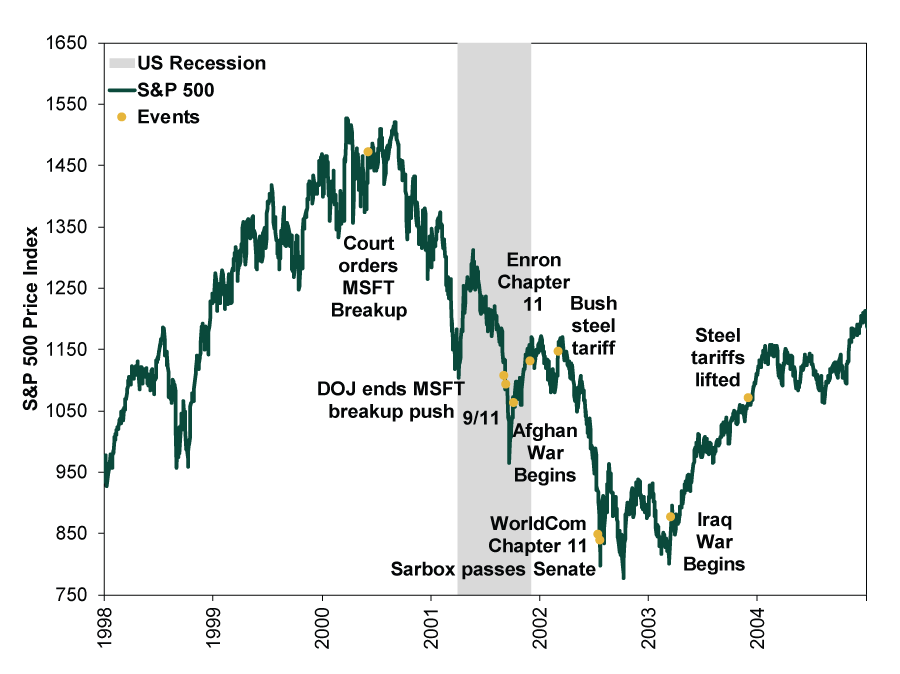
Source: FactSet, as of 3/2/2018. S&P 500 Price Index, 12/31/1997 – 12/31/2004.
It also seems like a stretch to pin 2002’s negativity on the tariffs when you consider that markets were still working through the Tech Bubble’s aftermath. Bush’s steel tariffs arrived nearly two years into the bear market that began on March 24, 2000. Yet Tech and Telecom, which led the bear down from the start, remained two of the worst performers after the tariffs.
Exhibit 3: Sector Performance Before and After the Bush Steel Tariffs
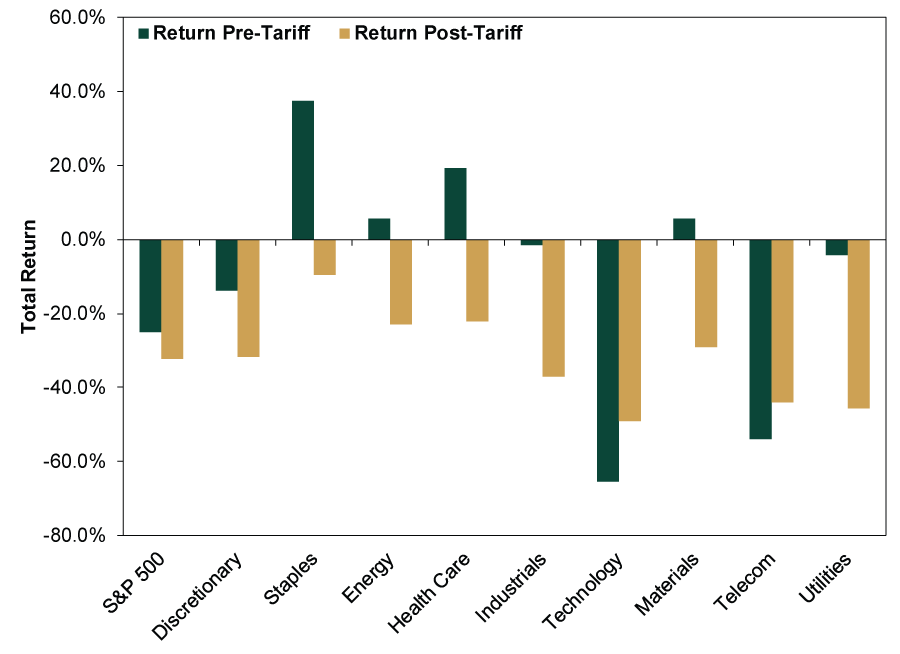
Source: FactSet, as of 3/6/2018. S&P 500 and S&P 500 sector returns (ex. Financials and Real Estate), 3/24/2000 – 10/9/2002. Tariffs were enacted on March 5, 2002.
Targeted tariffs are nothing new and, in our view, aren’t likely to derail markets. As we noted here last year, the US has routinely engaged in some form of protection for the steel industry. The proposed policy isn’t as much of a break from the norm as many would have you believe—even if the justification might differ.
Exhibit 4: US Policy on Steel Tariffs
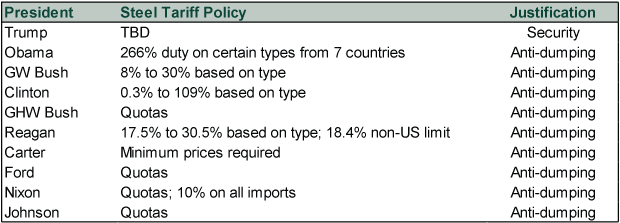
Source: National Bureau of Economic Research, as of 6/29/2017. For the record, Obama implemented steel tariffs twice (2014 and 2016). Our table cites the latter move.
If you would like to contact the editors responsible for this article, please message MarketMinder directly.
*The content contained in this article represents only the opinions and viewpoints of the Fisher Investments editorial staff.
Get a weekly roundup of our market insights
Sign up for our weekly e-mail newsletter.

You Imagine Your Future. We Help You Get There.
Are you ready to start your journey to a better financial future?

Where Might the Market Go Next?
Confidently tackle the market’s ups and downs with independent research and analysis that tells you where we think stocks are headed—and why.
Related Resources
-
Economics On Fires and GDP2026-07-30
-
Economics Quick Hit: Durably Broad-Based Growth2026-07-29
-
Market Analysis On the Chop in the Oil Market2026-07-29
-
Politics Takaichi Raises Japan’s Wall of Worry2026-07-27


Learn More
Learn why 210,000 clients trust us to manage their money and how Fisher Investments and its affiliates may be able to help you achieve your financial goals.
As of 6/30/2026
New to Fisher? Call Us.
Contact Us Today