Personal Wealth Management / Market Analysis
Steep Selloff Sign of Correction—Not Bear
Monday's volatility—and the prior week—look like the start of a correction, not a bear market.

The stock market selloff worsened Monday, when the S&P 500 tumbled 4.1%, its worst day since August 2011.[i] The index is now down -7.8% in price terms since its last all-time high on January 26, just seven trading days ago.[ii] Scary stuff, until you remember bull markets usually die with a whimper, not a bang. While this move hasn’t reached the threshold magnitude yet to earn the moniker, this drop is classic correction stuff, in our view, and likely not the start of a bear market. We think the wisest move now is to sit tight, lest you sell after a drop and get whipsawed by the recovery.
As a refresher, corrections are sharp, quick, sentiment-driven declines of -10% to -20% or so. They start suddenly and usually end equally quickly, with further gains on the other side. Bear markets, by contrast, are deeper (-20% or worse), longer and have identifiable fundamental causes. Corrections are fleeting and a normal part of any bull market. They help keep sentiment in check, preventing stocks from overheating and helping extend the bull’s lifespan. They aren’t possible to predict or time repeatedly, so enduring them is the toll we all pay for bull markets’ stellar longer-term returns. It is possible to navigate bear markets and cut out a chunk of the downside if you can spot one early enough.
Big down days like Monday do happen during bear markets, but usually not at the beginning. Bear markets usually roll over gradually, lulling investors into complacency with a gentle decline. The average monthly decline of a bear market is around -2% to -3%, with declines escalating at the end due to negative compounding. Those tame early declines suck people in, throwing more and more money at what they see as buying opportunities—they focus only on price movement, without looking at forward-looking fundamental indicators. They don’t announce themselves with steep early drops—if they did, they wouldn’t lure people back. Yet big down days during bull markets aren’t uncommon, either. Monday’s drop was the 10th of -3.5% or worse during this bull market alone.[iii] It wasn’t as extraordinary as you might think.
Bear markets generally don’t begin with spike tops. Exhibit 1 contrasts the past six days with the first six days of each of the past eight bear markets. Of them, only the 1980-1982 bear’s first six days come close to now—but even that wasn’t spike top. As Exhibit 2 shows, stocks clawed back much of that lost ground, coming close to breakeven a few weeks later, before resuming a slow downward grind.
Exhibit 1: A Bang and Several Whimpers
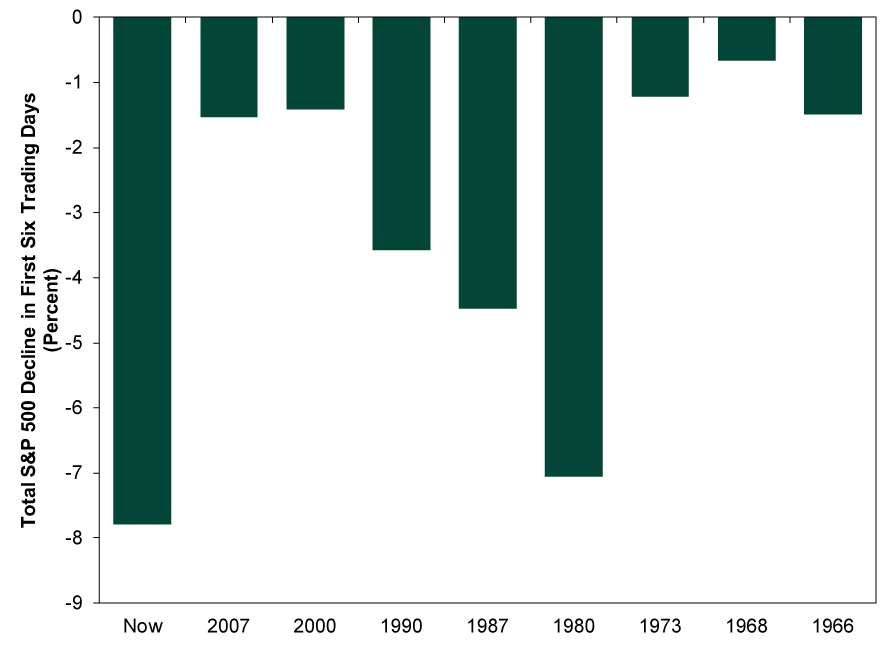
Source: FactSet, as of 2/5/2018. S&P 500 price return, 1/26/2018 – 2/5/2018; 10/9/2007 – 10/17/2007; 3/24/2000 – 4/3/2000; 7/16/1990 – 7/24/1990; 8/25/1987 – 9/2/1987; 11/28/1980 – 12/8/1980; 1/11/1973 – 1/20/1973; 11/29/1968 – 12/9/1968; 2/9/1966 – 2/17/1966.
Exhibit 2: 1980 Was a Whimper, Too
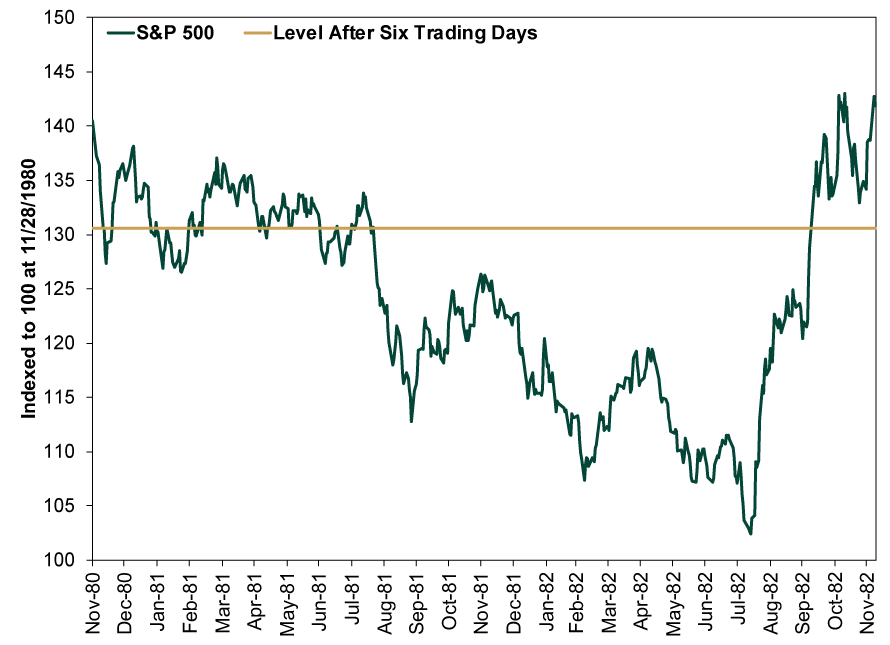
Source: FactSet, as of 2/5/2018. S&P 500 Price Index, 11/28/1980 – 12/8/1982.
We highlight 1980 to show a crucial point about bear markets: You needn’t nail the peak. There were plenty of viable selling opportunities during the first six months. Investors had plenty of time to take a deep breath, survey the fundamental landscape, and assess whether it was a correction or a bear market.
Even the 2007 – 2009 bear, which many remember for its violent down days, had a gradual onset. Stocks rolled over slowly in autumn 2007, and the decline didn’t really get going until the following March, when Bear Stearns imploded. Even then, stocks pared some of those losses in the spring before the decline resumed in earnest in summer. The big one-day drops, many of which dwarfed Monday’s, didn’t appear until September 2008.
In our view, if you need long-term growth to reach your investment goals, being out of the market is the biggest risk you can take. If you are on the sidelines while stocks rise, that can be a hefty setback. So we always urge investors to stay measured and rational, and not bolt at the first sign of trouble. If you sell after a week of bad volatility, and then stocks snap back, all you have done is locked in those losses and handicapped your potential recovery.
So we generally encourage folks to follow a simple rule: Never go defensive until at least three months have passed from the most recent peak. That gives you time to monitor fundamental indicators and weigh whether it is a correction—painful, but over quickly—or bear market. Bear markets begin one of two ways: atop the proverbial wall of worry, or with a wallop. Both are fundamental features. Euphoric or complacent investors ignoring some creeping signs of trouble, like an inverted yield curve or falling Leading Economic Index. Or, the wallop: an unseen negative development capable of knocking a few trillion off global GDP, like a world war or destructive piece of regulation. Neither impact is super sudden—this affords you time to do the careful study required to identify a bear unfolding. Corrections, by contrast, are sentiment-driven. They flip fast and without an identifiable cause or driver.
Today, we don’t see evidence of the wall or the wallop. Investors are cheerier today than in years past, but they aren’t out of worries. Even before the selloff began, folks feared high valuations, higher budget deficits, inflation, more Fed rate hikes and the potential for an overheating economy. At an actual peak, investors would spend most of their time searching for reasons stocks could still rise despite this, that and the other. As for wallops, we don’t see any presently. Tensions with North Korea remain unlikely to snowball into a full-fledged global war. Most governments in the developed world are gridlocked, reducing the likelihood of legislation with wallop-potential. Central banks globally are moving timidly, reducing the likelihood of a sudden monetary error. Protectionism is a risk, but the Trump administration isn’t doing much the Obama and Bush administrations didn’t do before. Neither president started a trade war.
Corrections can occur for any or no reason. Sometimes they have a big scary story associated with them. If this selloff breaches -10%, officially reaching correction territory, perhaps inflation and interest rates will be its story. Or maybe it will be the FBI memo. Or something else no one has thought of yet. Or, maybe there won’t be a story. Senseless freakouts happen. They are unsettling, but they aren’t the end.
So stay cool. If this does turn out to be a bear market, there is likely a better exit point than today’s. And if it is just a correction, as we believe is likeliest, you will be ready to capture the bounce back.
If you would like to contact the editors responsible for this article, please message MarketMinder directly.
*The content contained in this article represents only the opinions and viewpoints of the Fisher Investments editorial staff.
Get a weekly roundup of our market insights
Sign up for our weekly e-mail newsletter.

You Imagine Your Future. We Help You Get There.
Are you ready to start your journey to a better financial future?

Where Might the Market Go Next?
Confidently tackle the market’s ups and downs with independent research and analysis that tells you where we think stocks are headed—and why.
Related Resources
-
Market Analysis Why “War Winner” Trades Are Off Base2026-03-20
-
Market Analysis Around the World in Central Banking, Iran War Edition2026-03-19
-
Politics Beyond the War: A Political Roundup Covering America, Canada and Denmark2026-03-17
-
Economics Doubts Aplenty After UK January GDP Flatlined2026-03-17


Learn More
Learn why 195,000 clients trust us to manage their money and how Fisher Investments and its affiliates may be able to help you achieve your financial goals.
As of 12/31/2025
New to Fisher? Call Us.
Contact Us Today